AMT VEMA
Volatility-adjusted exponential moving average using Rate of Change
An innovative study that blends traditional exponential moving averages (EMA) with volatility adjustments based on Rate of Change (ROC). The EMA is continuously adjusted based on the absolute ROC value, ensuring the moving average mirrors not just the direction but also the magnitude of price movements.
The Concept
VEMA is a moving average that adapts its speed based on market volatility. Unlike a standard EMA that moves at a fixed rate, VEMA accelerates when price movement is strong and decelerates in quiet markets. This makes it faster to respond during trends and smoother during ranges, providing a more natural read of the market's moving center.
How to Read It
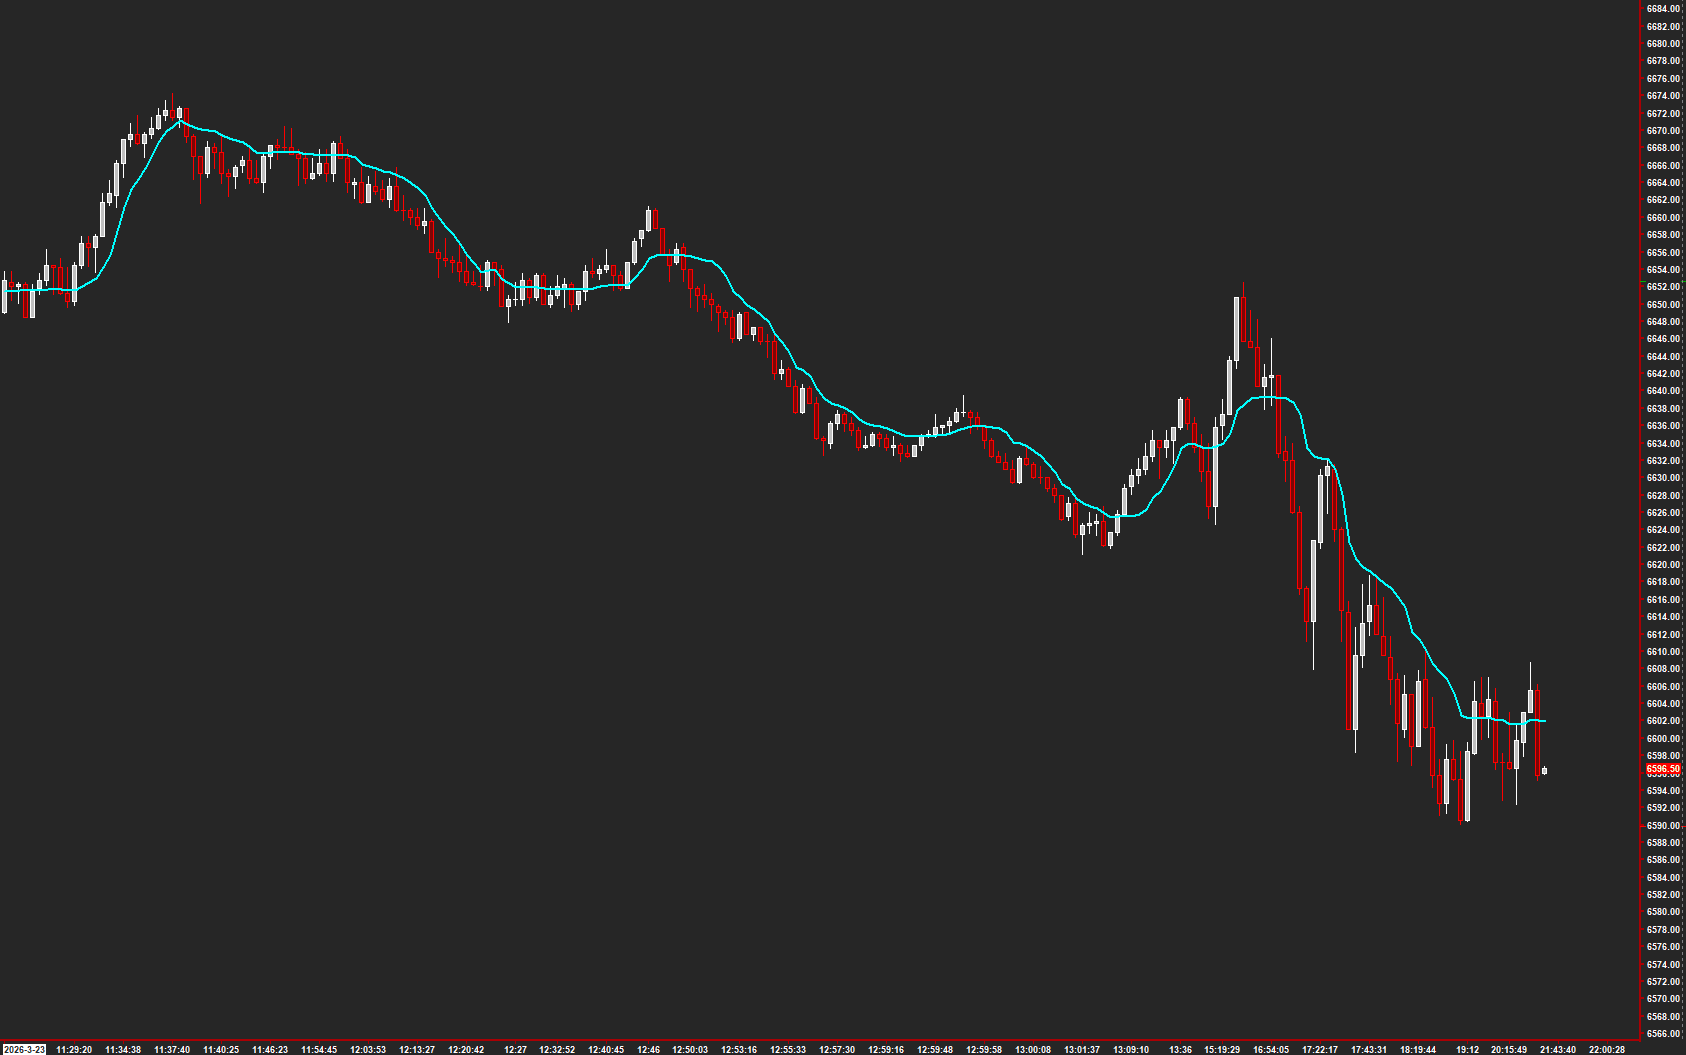
VEMA appears as a single adaptive line on the price chart.
- Price above VEMA suggests bullish momentum — use as dynamic support in uptrends
- Price below VEMA suggests bearish momentum — use as dynamic resistance in downtrends
- Flat VEMA indicates low volatility and consolidation
- VEMA slope changes often precede or confirm trend shifts
Practical Tips
The Input Length sets the base EMA speed, while the Volatility Period controls how quickly VEMA adapts to changing conditions. Shorter volatility periods make VEMA more reactive; longer periods provide smoother adaptation. VEMA works well as a trend filter for other studies — entries above VEMA lean long, entries below lean short.
Requirements
- Can only be used on charts with a chart data type of 'Intraday Chart'
- Recommended 'Intraday Data Storage Time Unit' setting '1 Tick'
Input & Settings
| No. | Input Name | Function |
|---|---|---|
| 1 | Input Data | Determines the price data that the study will use. While it defaults to closing prices, users can choose other price points such as open, high, or low, depending on their preferences. |
| 2 | Input Length | Defines the length (in periods) used for the exponential moving average calculation. The input data, over this length, will be used to compute the EMA. |
| 3 | Volatility Period | Dictates the period used to adjust the EMA for volatility, based on the Rate of Change (ROC). The ROC, calculated over this period, gauges the momentum of market movements. A shorter period makes the VEMA more reactive to recent shifts, while a longer period provides a smoother volatility adjustment. |
Determines the price data that the study will use. While it defaults to closing prices, users can choose other price points such as open, high, or low, depending on their preferences.
Defines the length (in periods) used for the exponential moving average calculation. The input data, over this length, will be used to compute the EMA.
Dictates the period used to adjust the EMA for volatility, based on the Rate of Change (ROC). The ROC, calculated over this period, gauges the momentum of market movements. A shorter period makes the VEMA more reactive to recent shifts, while a longer period provides a smoother volatility adjustment.
Subgraphs
| No. | Subgraph Name | Function & Comments |
|---|---|---|
| 1 | Vema | Default: Line. This plots the computed VEMA values. |
Default: Line. This plots the computed VEMA values.
Get Access to Every Study
All studies are included with the Gold License — proprietary Sierra Chart tools, Discord community access, and the full AMT framework.
Get the Gold License — $125/mo