AMT Channel
Volatility-based trend-following with ATR and adaptive moving averages
A volatility-based trend-following system that uses a combination of the Average True Range (ATR) and adaptive moving averages to gauge market trends and strength. Includes Trend bands for direction, a Strength subgraph for momentum, a dynamic Stop level, and an Adaptive Moving Average that adjusts to price volatility.
The Concept
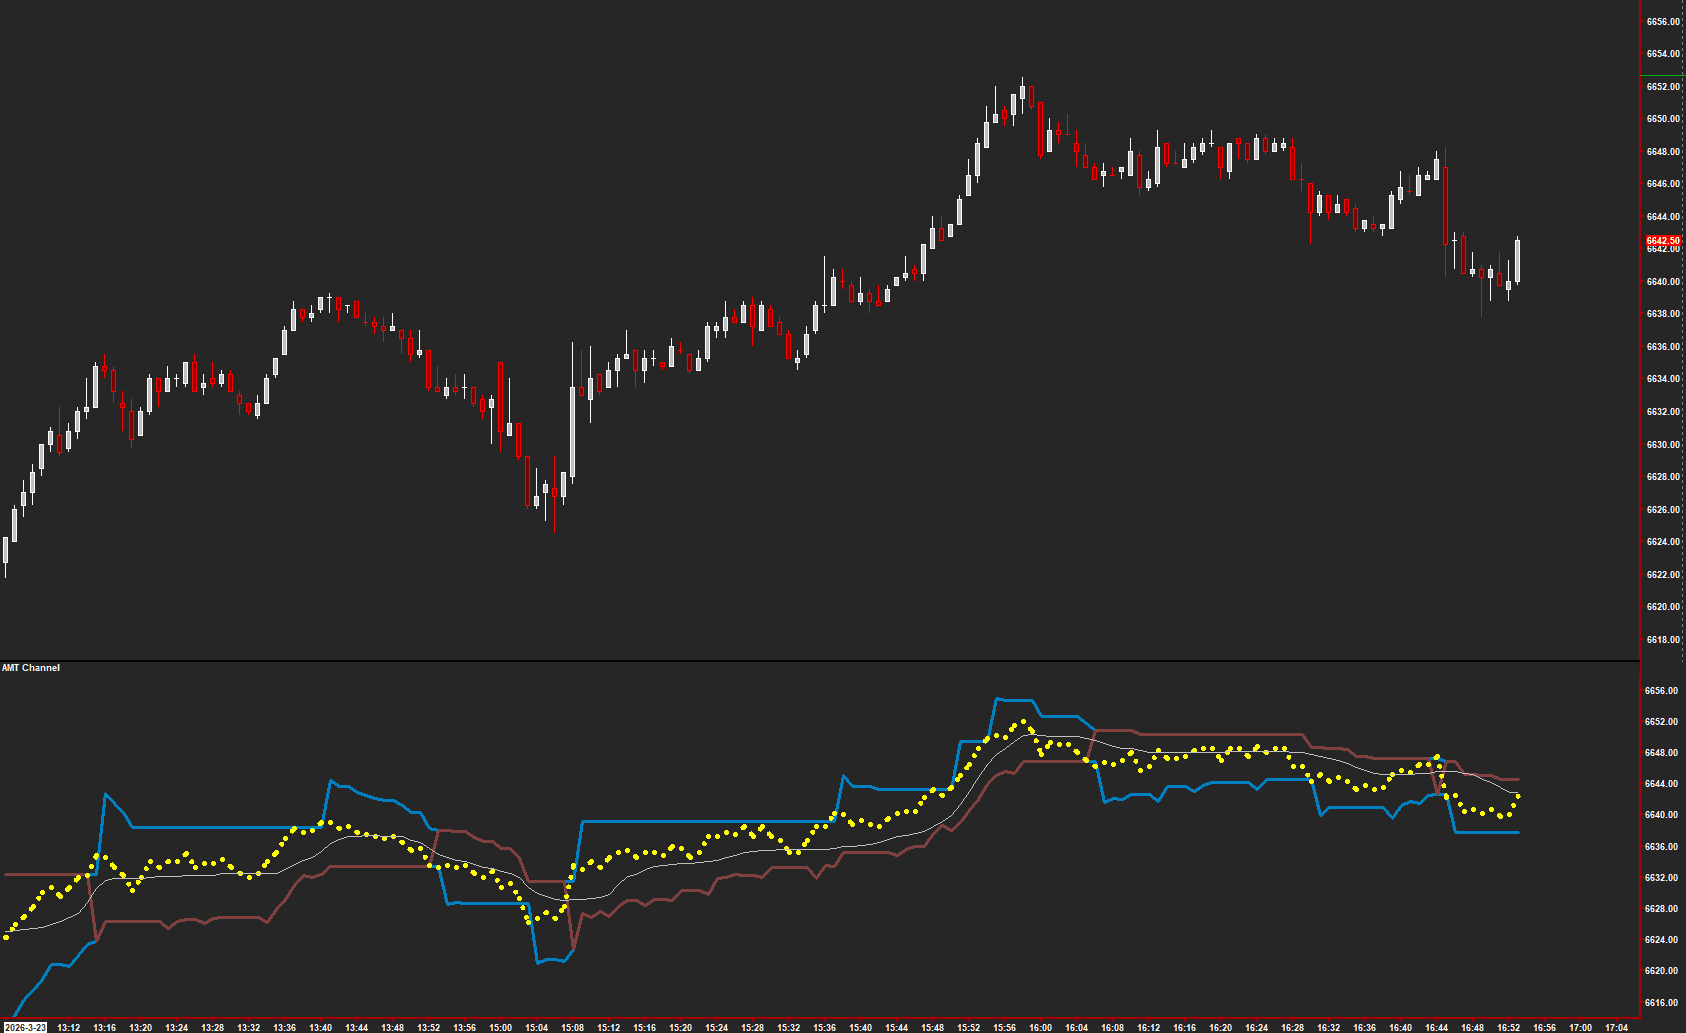
AMT Channel measures trend direction and strength through volatility-adaptive bands. An upper Trend band, lower Trend+ band, and dynamic Stop level move with price based on recent volatility. When price extends beyond the bands, the Strength subgraph confirms whether momentum is genuine. An Adaptive Moving Average adjusts its sensitivity to match current market conditions.
How to Read It
The bands and stop level provide a visual framework for trend-following.
- Price above the Trend band with rising Strength confirms a strong uptrend
- Price below the Trend+ band with falling Strength confirms a strong downtrend
- The Stop level trails behind price and provides a trailing exit reference
- The Adaptive Moving Average acts as dynamic support/resistance that adjusts to volatility
Practical Tips
Works best on intraday charts with 1-tick data resolution. The ATR Multiplier and Period control band width — wider bands for longer-term trends, tighter for scalps. Pair with AMT TP or AMT Balance for directional bias confirmation. The Strength subgraph in a separate region helps filter false breakouts.
Requirements
- Can only be used on charts with a chart data type of 'Intraday Chart'
- Recommended 'Intraday Data Storage Time Unit' setting '1 Tick'
Input & Settings
| No. | Input Name | Function |
|---|---|---|
| 1 | Input Data | Allows the user to select the type of price data they wish to utilize for analysis, such as Close, Open, High, Low, etc. |
| 2 | ATR Multiplier | The ATR Multiplier is used to scale the Average True Range (ATR), a volatility measure. Adjusting this multiplier will influence the sensitivity of indicators relying on the ATR. |
| 3 | ATR Period | This input determines the number of periods or bars used to calculate the Average True Range (ATR). A smaller number makes the ATR more reactive to recent price changes, while a larger number smoothens it out. |
| 4 | ATR Moving Average Type | This setting allows users to choose the type of moving average to be applied to the ATR. Different moving averages can affect the responsiveness and smoothness of the ATR. |
| 5 | Adaptive Moving Average Length | This input sets the length for the Adaptive Moving Average, which determines how many periods or bars are used for its calculation. A longer length will produce a smoother average, while a shorter length will be more reactive to recent price data. |
| 6 | Fast Smoothing Constant | The Fast Smoothing Constant is used to adjust the speed of smoothing for certain calculations. A higher value makes calculations more reactive to recent data. |
| 7 | Slow Smoothing Constant | Opposite to the fast constant, the Slow Smoothing Constant adjusts the smoothing speed, but at a slower rate. A higher value results in more lag and a smoother curve or line. |
Allows the user to select the type of price data they wish to utilize for analysis, such as Close, Open, High, Low, etc.
The ATR Multiplier is used to scale the Average True Range (ATR), a volatility measure. Adjusting this multiplier will influence the sensitivity of indicators relying on the ATR.
This input determines the number of periods or bars used to calculate the Average True Range (ATR). A smaller number makes the ATR more reactive to recent price changes, while a larger number smoothens it out.
This setting allows users to choose the type of moving average to be applied to the ATR. Different moving averages can affect the responsiveness and smoothness of the ATR.
This input sets the length for the Adaptive Moving Average, which determines how many periods or bars are used for its calculation. A longer length will produce a smoother average, while a shorter length will be more reactive to recent price data.
The Fast Smoothing Constant is used to adjust the speed of smoothing for certain calculations. A higher value makes calculations more reactive to recent data.
Opposite to the fast constant, the Slow Smoothing Constant adjusts the smoothing speed, but at a slower rate. A higher value results in more lag and a smoother curve or line.
Subgraphs
| No. | Subgraph Name | Function & Comments |
|---|---|---|
| 1 | Trend | Default: Line. Indicates the 'Trend' using the Upper Band. Typically, upper bands in charting tools are used to show potential overbought levels or upward price movement. |
| 2 | Trend + | Default: Line. 'Trend+' is represented by the Lower Band, commonly used in charting to denote potential oversold levels or downward price movement when flipped. |
| 3 | Stop | Default: Line. The 'Stop' subgraph is associated with the Trend and Trend+ a trend-following indicator that provides buy or sell signals. |
| 4 | Strength | Default: Line. This subgraph represents the 'Strength' of an asset or metric, based on its price. |
| 5 | Adaptive Moving Average | Default: Line. Displays a type of moving average that adjusts its length based on market conditions, often making it more responsive to price changes. |
Default: Line. Indicates the 'Trend' using the Upper Band. Typically, upper bands in charting tools are used to show potential overbought levels or upward price movement.
Default: Line. 'Trend+' is represented by the Lower Band, commonly used in charting to denote potential oversold levels or downward price movement when flipped.
Default: Line. The 'Stop' subgraph is associated with the Trend and Trend+ a trend-following indicator that provides buy or sell signals.
Default: Line. This subgraph represents the 'Strength' of an asset or metric, based on its price.
Default: Line. Displays a type of moving average that adjusts its length based on market conditions, often making it more responsive to price changes.
Get Access to Every Study
All studies are included with the Gold License — proprietary Sierra Chart tools, Discord community access, and the full AMT framework.
Get the Gold License — $125/mo