AMT Delta Efficiency
Volume-to-delta conversion efficiency oscillator
Measures how efficiently volume converts into directional delta on both the bid and offer sides. Features smoothed efficiency lines, min/max swing levels, an efficiency midpoint, and crossover signals. Designed for volume charts with per-product volume settings.
The Concept
Not all volume is equal — sometimes heavy volume produces a large delta (efficient conversion), and sometimes heavy volume produces little directional movement (absorbed by passive orders). Delta Efficiency measures how effectively volume translates into directional commitment on each side of the market. High offer efficiency with rising price confirms genuine buying pressure; low efficiency during a rally warns of potential absorption.
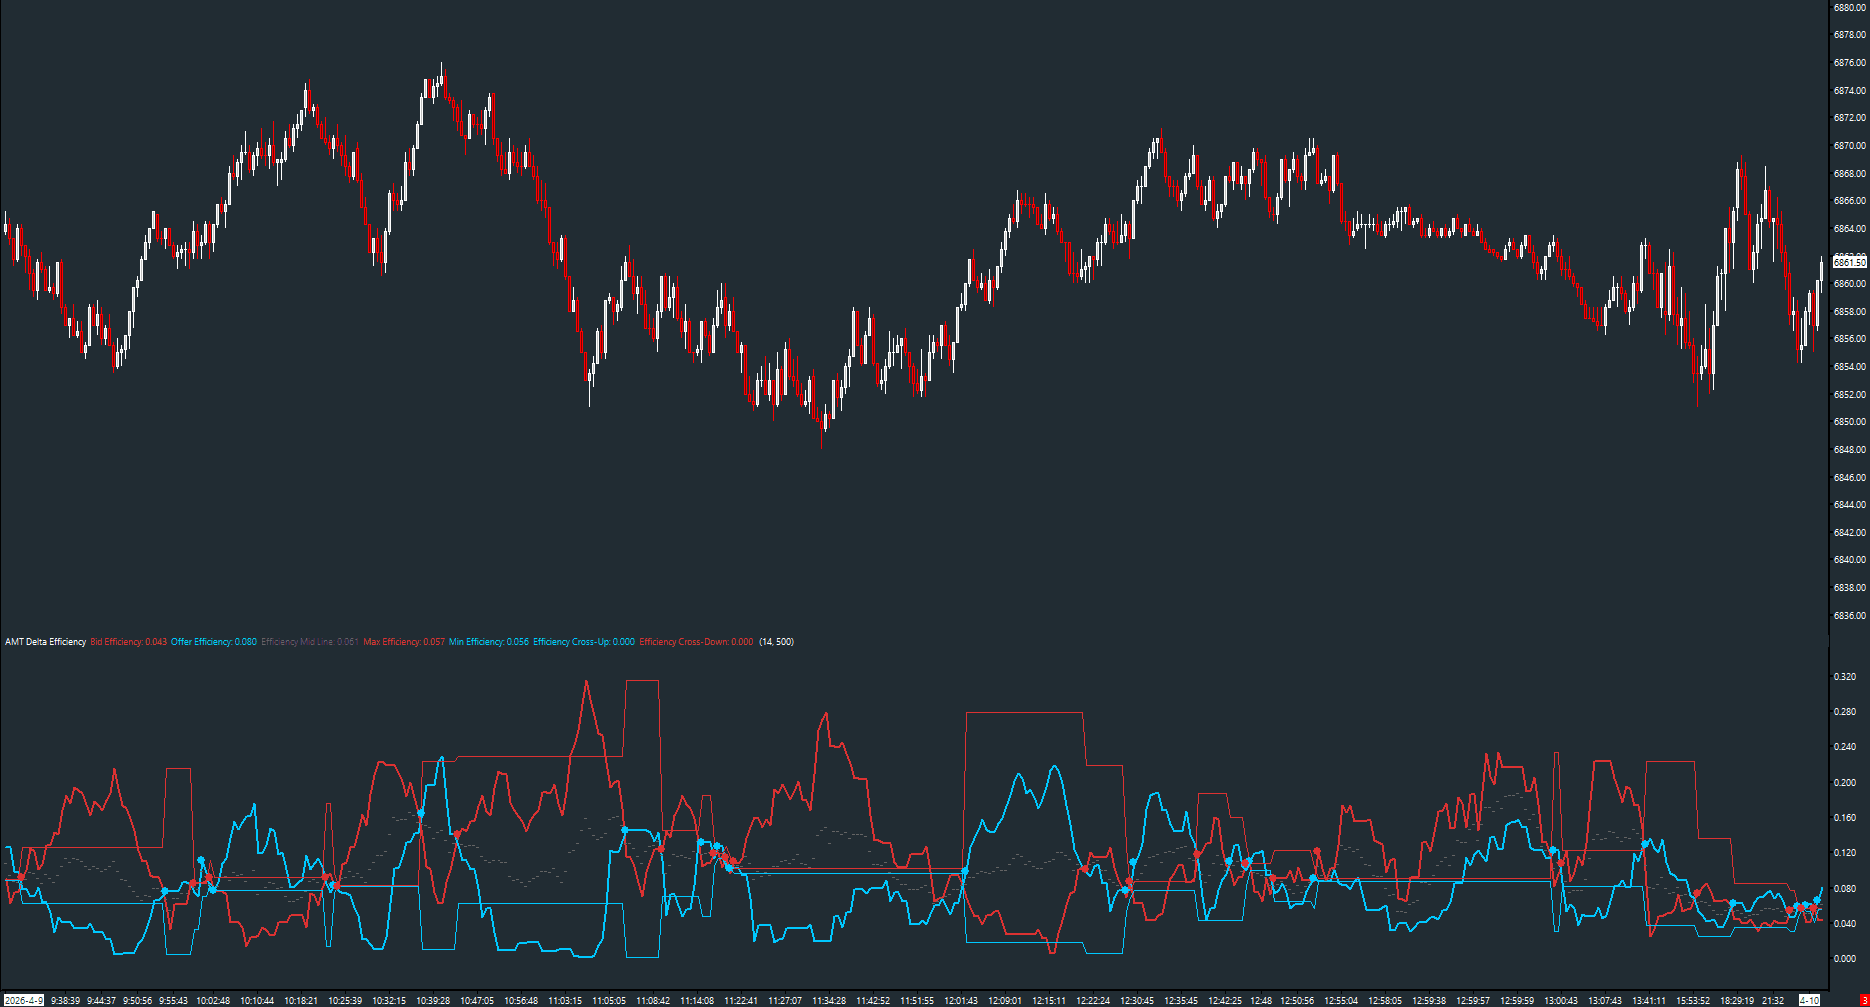
How to Read It
Two efficiency lines (bid in red, offer in cyan) oscillate relative to each other.
- Offer Efficiency rising above Bid Efficiency = buyers are converting more volume into delta (bullish)
- Bid Efficiency rising above Offer Efficiency = sellers are converting more volume into delta (bearish)
- Cross-Up dots (cyan) mark bullish crossover — offer efficiency crosses above bid
- Cross-Down dots (red) mark bearish crossover — bid efficiency crosses above offer
- Max/Min lines lock in the prior swing's high/low efficiency for range context
Practical Tips
Place this on a volume chart (not time-based) for best results. Recommended volume settings per product: ES=1300, NQ=500, RTY=175, CL=375, GC=135. The MA Period smooths the raw efficiency ratio — shorter periods are noisier but more responsive. The efficiency crossover signals work similarly to MACD crosses but are purely order-flow based.
Input & Settings
| No. | Input Name | Function |
|---|---|---|
| 1 | Efficiency MA Period | Smoothing period for the bid and offer efficiency ratios. Default: 14. Range: 1–200. |
| 2 | Volume Setting | Volume setting for the chart. Product-specific; affects efficiency calculation precision. Default: 500. |
Smoothing period for the bid and offer efficiency ratios. Default: 14. Range: 1–200.
Volume setting for the chart. Product-specific; affects efficiency calculation precision. Default: 500.
Subgraphs
| No. | Subgraph Name | Function & Comments |
|---|---|---|
| 1 | Bid Efficiency | Default: Line. Smoothed bid-side efficiency ratio, displayed in red. |
| 2 | Offer Efficiency | Default: Line. Smoothed offer-side efficiency ratio, displayed in cyan. |
| 3 | Efficiency Mid Line | Default: Dash (dotted). Midpoint of the two efficiency lines. |
| 4 | Max Efficiency | Default: Line. Locked high from the prior efficiency swing, displayed in red. |
| 5 | Min Efficiency | Default: Line. Locked low from the prior efficiency swing, displayed in cyan. |
| 6 | Efficiency Cross-Up | Default: Point. Marks where offer efficiency crosses above bid efficiency. Cyan dot. |
| 7 | Efficiency Cross-Down | Default: Point. Marks where bid efficiency crosses above offer efficiency. Red dot. |
Default: Line. Smoothed bid-side efficiency ratio, displayed in red.
Default: Line. Smoothed offer-side efficiency ratio, displayed in cyan.
Default: Dash (dotted). Midpoint of the two efficiency lines.
Default: Line. Locked high from the prior efficiency swing, displayed in red.
Default: Line. Locked low from the prior efficiency swing, displayed in cyan.
Default: Point. Marks where offer efficiency crosses above bid efficiency. Cyan dot.
Default: Point. Marks where bid efficiency crosses above offer efficiency. Red dot.
Free with the AMT Toolkit
This study is part of the AMT Toolkit — a free collection of Sierra Chart studies for orderflow, market structure, and chart utilities.
Get the AMT Toolkit — Free