Price-Oscillator Divergence
Detects divergence between price and oscillator for reversal signals
Automatically detects divergence between price action and oscillator readings — a classic precursor to trend reversals. Identifies both regular and hidden divergence patterns, with optional warning signals for developing divergences. Includes confluence and balance filters for signal refinement.
The Concept
Divergence between price and an oscillator is one of the most reliable precursors to trend reversals. This study automates the detection by comparing swing pivots in price against corresponding pivots in any referenced oscillator. It identifies both regular divergence (reversal signals) and hidden divergence (continuation signals), with optional early warnings for developing patterns.
How to Read It
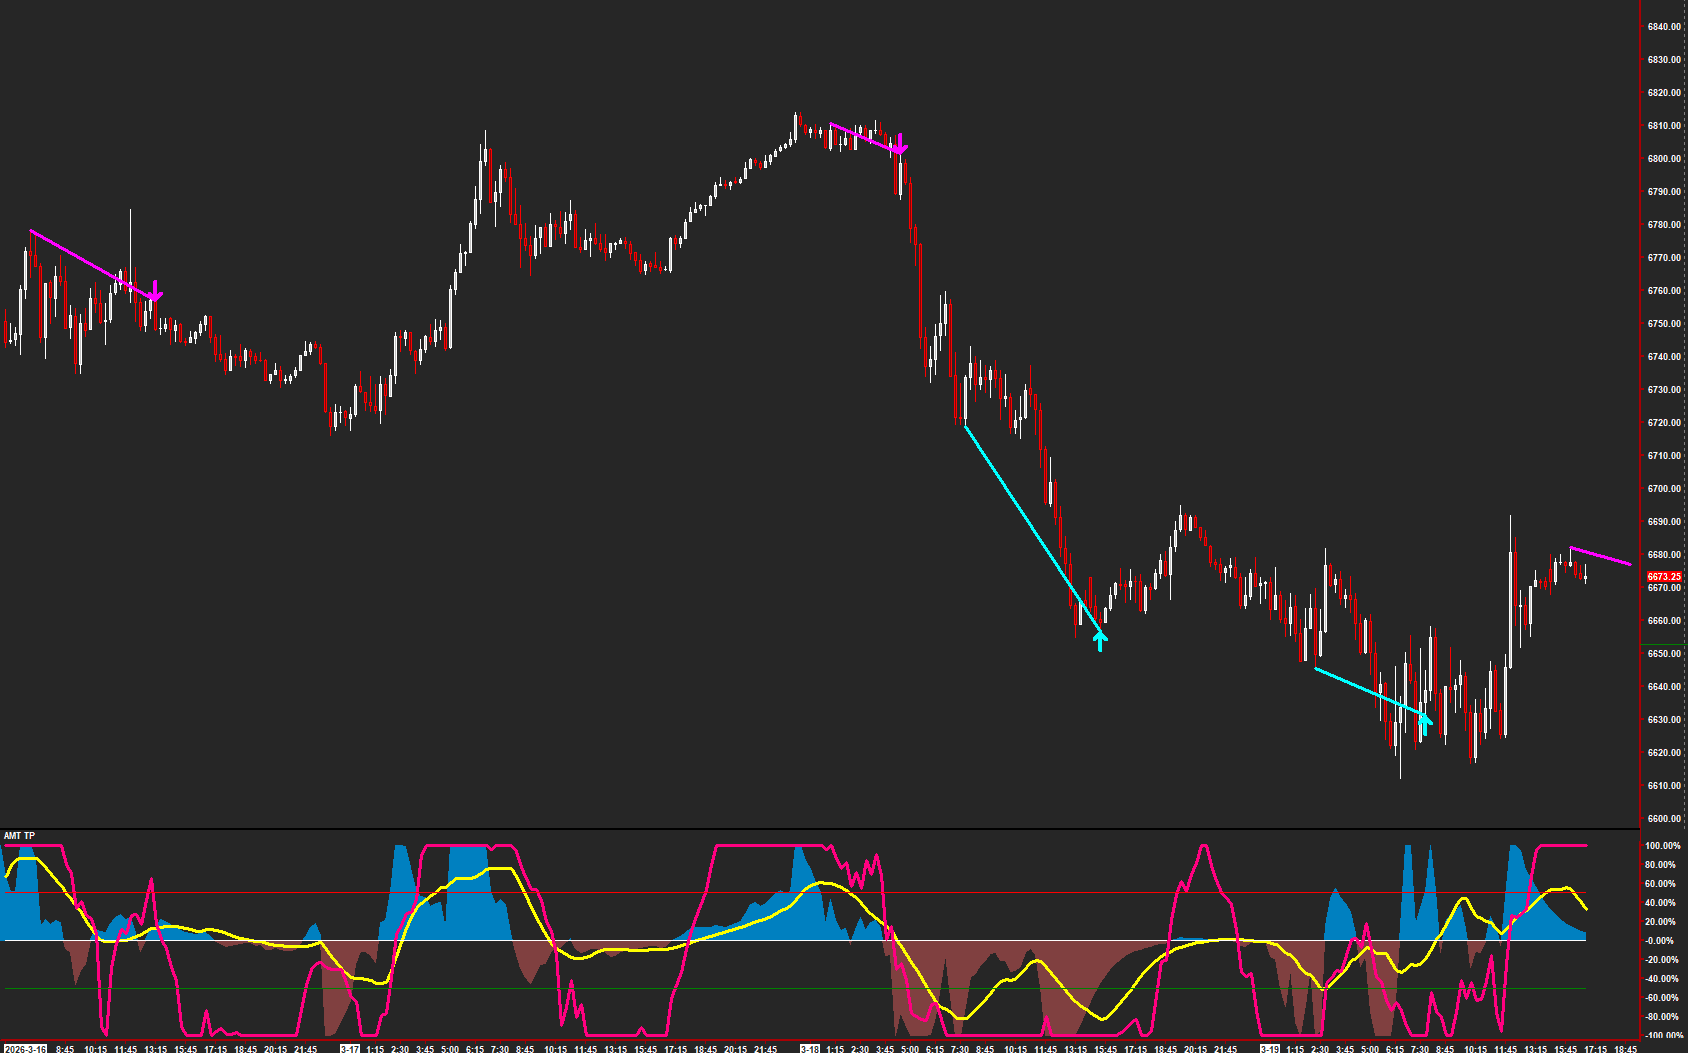
Arrows and connecting lines mark confirmed and developing divergence patterns.
- Regular Bullish — price makes a lower low but the oscillator makes a higher low, signaling potential reversal up
- Regular Bearish — price makes a higher high but the oscillator makes a lower high, signaling potential reversal down
- Hidden Bullish/Bearish — oscillator diverges from price in the trend direction, signaling continuation
- Warning signals appear when a divergence pattern is forming but not yet fully confirmed
Practical Tips
Reference any oscillator study via the Oscillator Study Subgraph input — AMT TP, Dual Stochastic RSI, LWPI, or CCI all work well. The pivot sensitivity settings control how significant the swing points must be. Enable the Confluence Filter to require a second oscillator to agree, or the Balance Filter to show divergences only at structurally meaningful locations.
Requirements
- An external oscillator study must be present on the chart and referenced via the Oscillator Study Subgraph input
Input & Settings
| No. | Input Name | Function |
|---|---|---|
| 1 | Oscillator Study Subgraph | References the oscillator study and subgraph to monitor for divergence against price. |
| 2 | Left Pivot Sensitivity | Number of bars required on the left side to confirm a swing pivot point. Default: 5. |
| 3 | Right Pivot Left | Number of bars to the left of the right pivot for confirmation. Default: 5. |
| 4 | Right Pivot Right | Number of bars to the right of the right pivot for confirmation. Default: 5. |
| 5 | Enable Regular Divergence | Enables detection of regular (classic) divergence patterns. Default: Yes. |
| 6 | Enable Hidden Divergence | Enables detection of hidden divergence patterns, which signal trend continuation. Default: Yes. |
| 7 | Show Divergence Lines | When enabled, draws lines connecting the divergent pivot points on both price and the oscillator. Default: Yes. |
| 8 | Arrow Offset (ticks) | Distance in ticks to offset the signal arrows from the bar high/low. Default: 2. |
| 9 | Divergence Line Width | Line width for confirmed divergence lines drawn on the chart. Default: 2. |
| 10 | Warning Line Width | Line width for warning (developing) divergence lines. Default: 1. |
| 11 | Enable Warning Signals | Enables early warning signals for divergences that are still forming but have not yet fully confirmed. Default: Yes. |
| 12 | Signal Type | Filters which divergence signals to display. 0 = Both bullish and bearish, 1 = Bullish only, 2 = Bearish only. Default: 0 (Both). |
| 13 | Enable Oscillator Confluence Filter | When enabled, requires a second oscillator to agree with the divergence signal before displaying it. Default: No. |
| 14 | Oscillator Confluence Study Subgraph | References the second oscillator study and subgraph used for confluence filtering. |
| 15 | Enable Balance Filter | When enabled, filters signals based on price position relative to a reference level (e.g., VWAP or Balance). Default: No. |
| 16 | Balance Filter Study Subgraph | References the study and subgraph used as the balance/reference level for filtering. |
| 17 | Color: Warning Bullish | Color for warning bullish divergence signals. |
| 18 | Color: Warning Bearish | Color for warning bearish divergence signals. |
| 19 | Color: Regular Bullish | Color for confirmed regular bullish divergence signals. Default: Green. |
| 20 | Color: Regular Bearish | Color for confirmed regular bearish divergence signals. Default: Red. |
| 21 | Color: Hidden Bullish | Color for confirmed hidden bullish divergence signals. Default: Blue. |
| 22 | Color: Hidden Bearish | Color for confirmed hidden bearish divergence signals. Default: Orange. |
| 23 | Warning Signal Minimum Completion (%) | Minimum percentage completion required before a warning signal is displayed. Default: 80%. |
References the oscillator study and subgraph to monitor for divergence against price.
Number of bars required on the left side to confirm a swing pivot point. Default: 5.
Number of bars to the left of the right pivot for confirmation. Default: 5.
Number of bars to the right of the right pivot for confirmation. Default: 5.
Enables detection of regular (classic) divergence patterns. Default: Yes.
Enables detection of hidden divergence patterns, which signal trend continuation. Default: Yes.
When enabled, draws lines connecting the divergent pivot points on both price and the oscillator. Default: Yes.
Distance in ticks to offset the signal arrows from the bar high/low. Default: 2.
Line width for confirmed divergence lines drawn on the chart. Default: 2.
Line width for warning (developing) divergence lines. Default: 1.
Enables early warning signals for divergences that are still forming but have not yet fully confirmed. Default: Yes.
Filters which divergence signals to display. 0 = Both bullish and bearish, 1 = Bullish only, 2 = Bearish only. Default: 0 (Both).
When enabled, requires a second oscillator to agree with the divergence signal before displaying it. Default: No.
References the second oscillator study and subgraph used for confluence filtering.
When enabled, filters signals based on price position relative to a reference level (e.g., VWAP or Balance). Default: No.
References the study and subgraph used as the balance/reference level for filtering.
Color for warning bullish divergence signals.
Color for warning bearish divergence signals.
Color for confirmed regular bullish divergence signals. Default: Green.
Color for confirmed regular bearish divergence signals. Default: Red.
Color for confirmed hidden bullish divergence signals. Default: Blue.
Color for confirmed hidden bearish divergence signals. Default: Orange.
Minimum percentage completion required before a warning signal is displayed. Default: 80%.
Subgraphs
| No. | Subgraph Name | Function & Comments |
|---|---|---|
| 1 | Regular Bullish | Default: Arrow Up. Marks confirmed regular bullish divergence — price makes a lower low while the oscillator makes a higher low. |
| 2 | Regular Bearish | Default: Arrow Down. Marks confirmed regular bearish divergence — price makes a higher high while the oscillator makes a lower high. |
| 3 | Hidden Bullish | Default: Arrow Up. Marks confirmed hidden bullish divergence — price makes a higher low while the oscillator makes a lower low, signaling trend continuation. |
| 4 | Hidden Bearish | Default: Arrow Down. Marks confirmed hidden bearish divergence — price makes a lower high while the oscillator makes a higher high, signaling trend continuation. |
| 5 | Warning Bullish | Default: Arrow Up. Marks developing bullish divergence that has not yet fully confirmed. |
| 6 | Warning Bearish | Default: Arrow Down. Marks developing bearish divergence that has not yet fully confirmed. |
Default: Arrow Up. Marks confirmed regular bullish divergence — price makes a lower low while the oscillator makes a higher low.
Default: Arrow Down. Marks confirmed regular bearish divergence — price makes a higher high while the oscillator makes a lower high.
Default: Arrow Up. Marks confirmed hidden bullish divergence — price makes a higher low while the oscillator makes a lower low, signaling trend continuation.
Default: Arrow Down. Marks confirmed hidden bearish divergence — price makes a lower high while the oscillator makes a higher high, signaling trend continuation.
Default: Arrow Up. Marks developing bullish divergence that has not yet fully confirmed.
Default: Arrow Down. Marks developing bearish divergence that has not yet fully confirmed.
Get Access to Every Study
All studies are included with the Gold License — proprietary Sierra Chart tools, Discord community access, and the full AMT framework.
Get the Gold License — $125/mo