34 EMA Wave Bar Coloring
Bar coloring based on the 34 EMA wave for visual trend identification
Colors chart bars based on their relationship to the 34-period Exponential Moving Average wave. Provides an instant visual read of whether price is trending above or below the EMA wave, making trend direction immediately apparent.
The Concept
This study provides instant visual context by coloring every bar based on its position relative to the 34-period EMA wave. Three zones — above the wave (bullish), within the wave (neutral), and below the wave (bearish) — create a traffic-light system for trend direction that's visible at a glance.
How to Read It
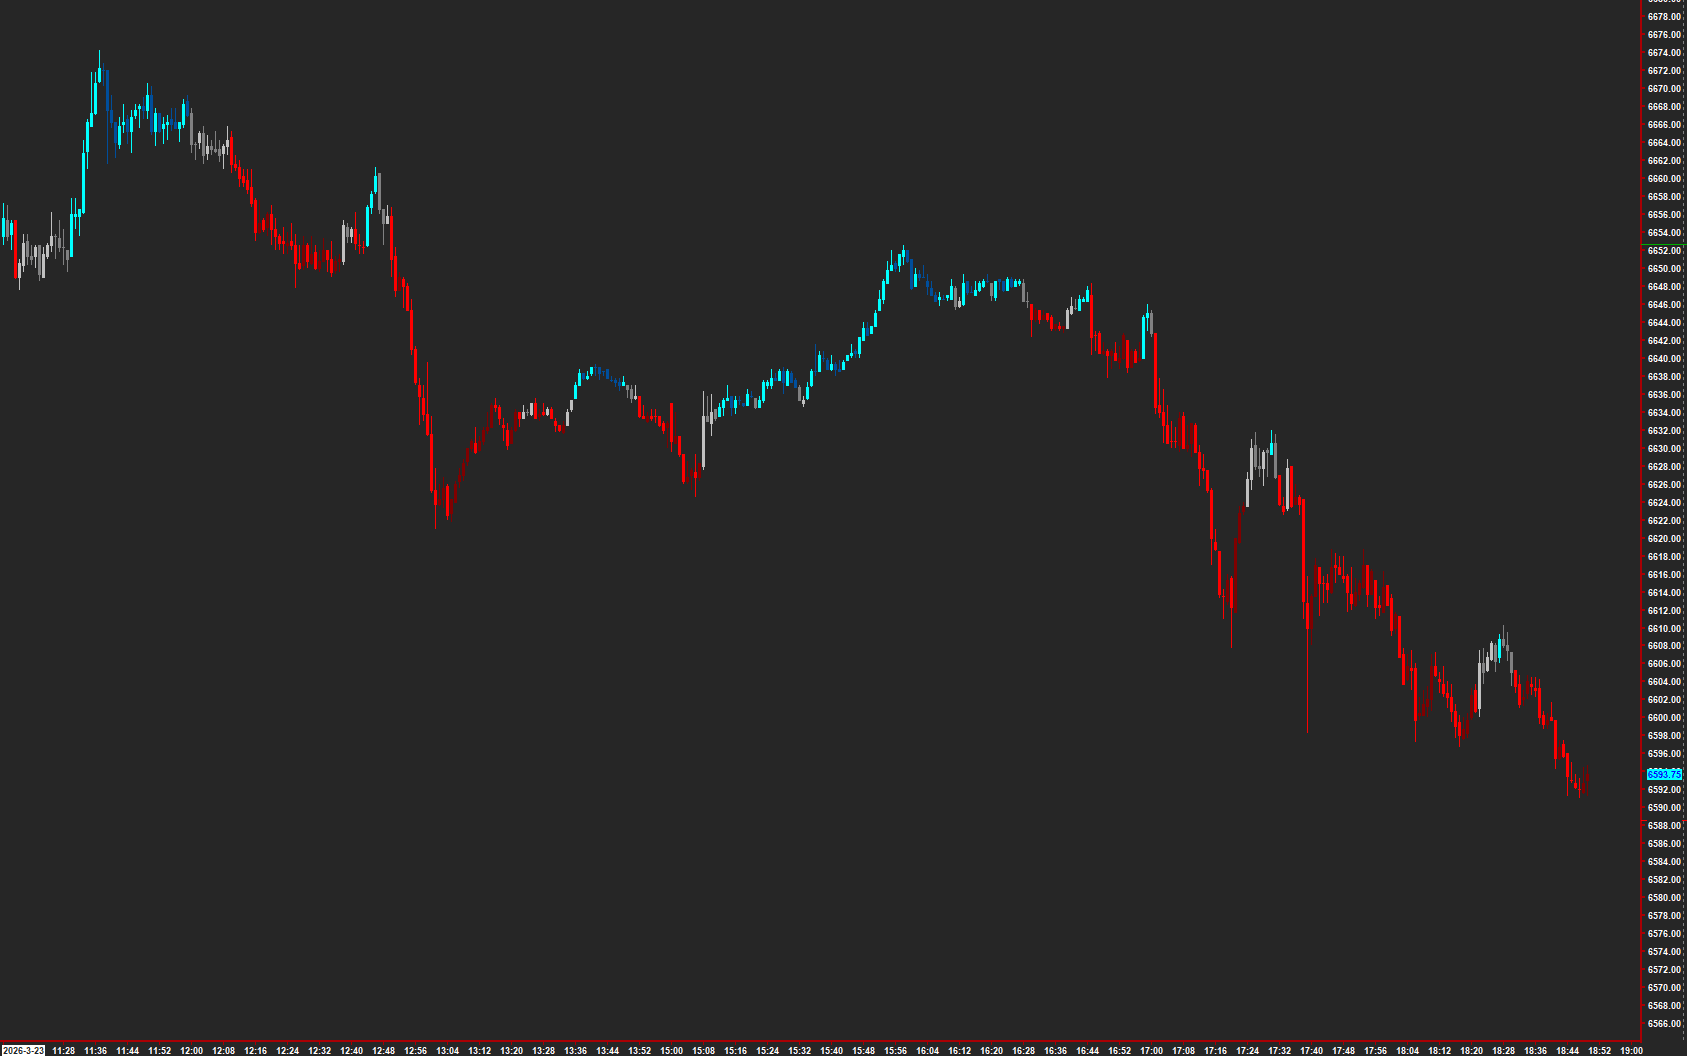
Six bar colors represent the combination of trend zone and candle direction.
- Bullish Up/Down — price is above the 34 EMA wave, trend is up
- Neutral Up/Down — price is within the 34 EMA wave, trend is transitioning
- Bearish Up/Down — price is below the 34 EMA wave, trend is down
- Transitions from neutral to bullish or bearish mark potential trend initiations
Practical Tips
No inputs to configure — just add it and read the colors. Works on any chart type and timeframe. The 34 EMA wave provides a natural separation between trending and mean-reverting conditions. Combine with AMT Balance levels to see how trend state aligns with structural location.
Subgraphs
| No. | Subgraph Name | Function & Comments |
|---|---|---|
| 1 | Bullish Up | Default: Color Bar Candle Fill. Colors bars where price is above the EMA wave and the bar closes higher than it opens. |
| 2 | Bullish Down | Default: Color Bar Candle Fill. Colors bars where price is above the EMA wave but the bar closes lower than it opens. |
| 3 | Neutral Up | Default: Color Bar Candle Fill. Colors bars where price is within the EMA wave and the bar closes higher than it opens. |
| 4 | Neutral Down | Default: Color Bar Candle Fill. Colors bars where price is within the EMA wave and the bar closes lower than it opens. |
| 5 | Bearish Up | Default: Color Bar Candle Fill. Colors bars where price is below the EMA wave and the bar closes higher than it opens. |
| 6 | Bearish Down | Default: Color Bar Candle Fill. Colors bars where price is below the EMA wave and the bar closes lower than it opens. |
Default: Color Bar Candle Fill. Colors bars where price is above the EMA wave and the bar closes higher than it opens.
Default: Color Bar Candle Fill. Colors bars where price is above the EMA wave but the bar closes lower than it opens.
Default: Color Bar Candle Fill. Colors bars where price is within the EMA wave and the bar closes higher than it opens.
Default: Color Bar Candle Fill. Colors bars where price is within the EMA wave and the bar closes lower than it opens.
Default: Color Bar Candle Fill. Colors bars where price is below the EMA wave and the bar closes higher than it opens.
Default: Color Bar Candle Fill. Colors bars where price is below the EMA wave and the bar closes lower than it opens.
Get Access to Every Study
All studies are included with the Gold License — proprietary Sierra Chart tools, Discord community access, and the full AMT framework.
Get the Gold License — $125/mo