AMT Trend Zero
ATR + Cycles integration for dynamic support and resistance
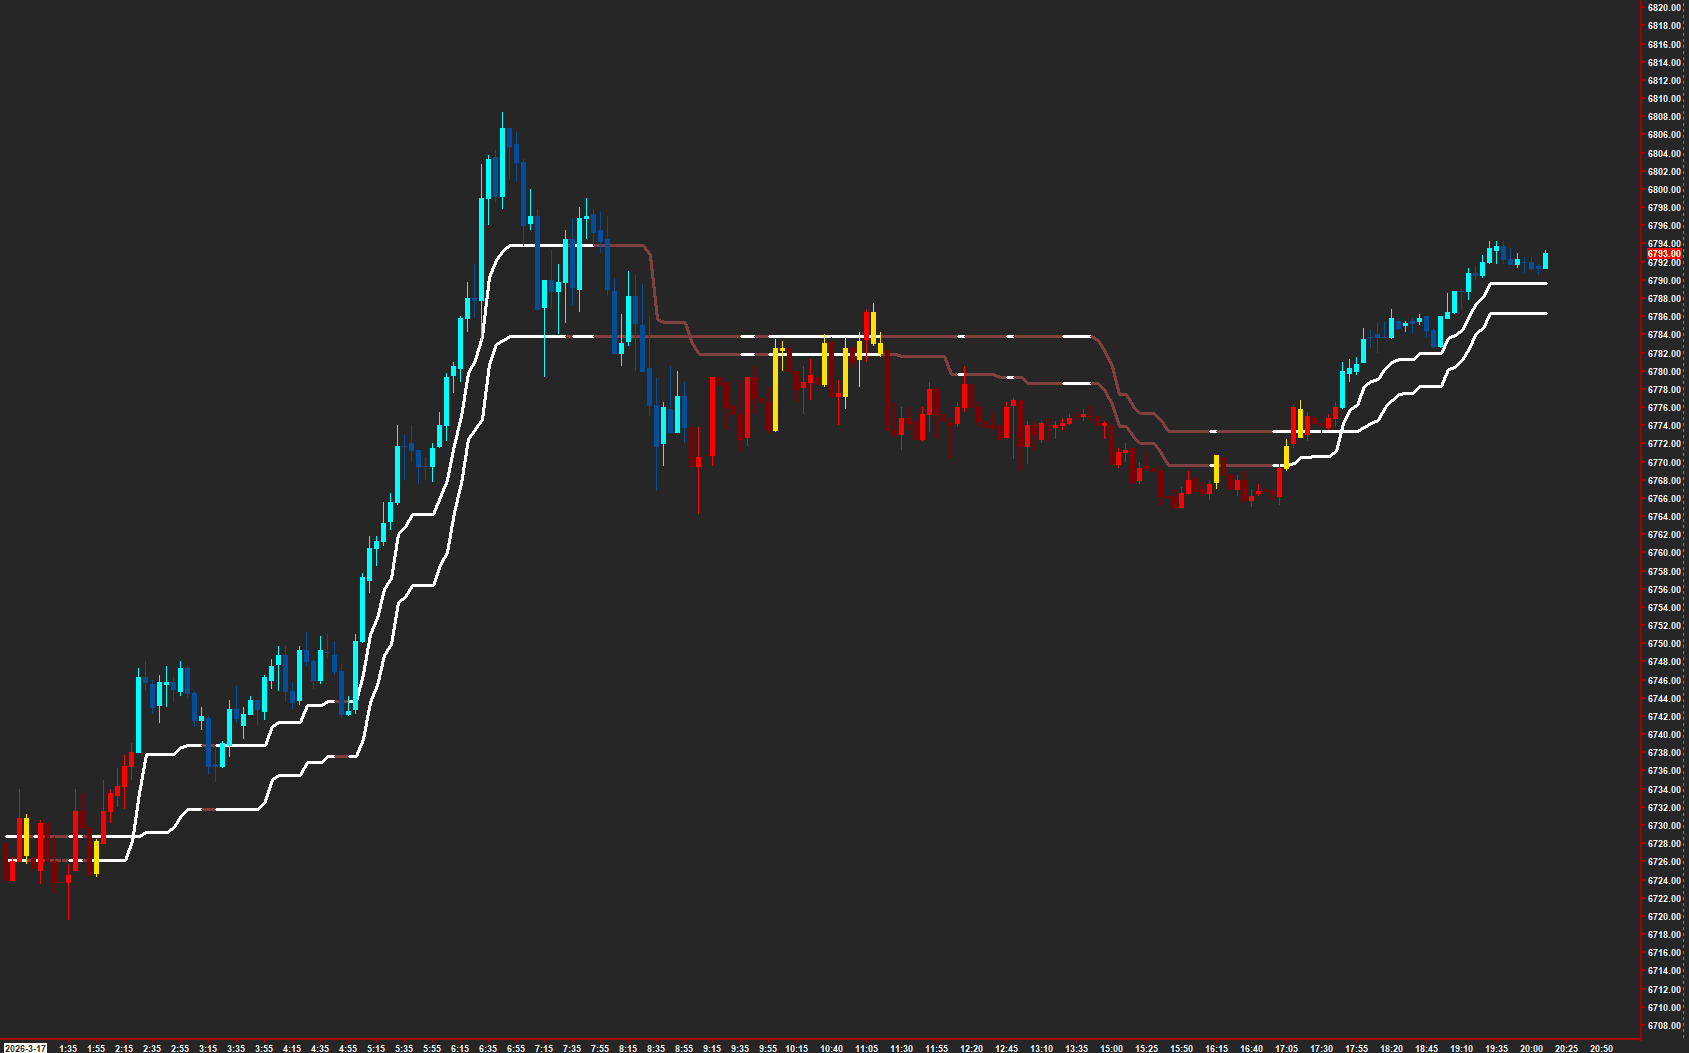
An advanced technical analysis tool that integrates the Average True Range (ATR) and Cycles to provide insights into market trends. It produces two adaptive trend lines — Alpha and Beta — that serve as dynamic support and resistance levels, with color-coded bars showing the relationship between price and the trend lines.
The Concept
Trend Zero combines cycle analysis with volatility to produce two adaptive trend lines — Alpha and Beta — that act as dynamic support and resistance. The relationship between Alpha and Beta, and where price sits relative to both, creates a multi-state read on trend direction and strength. Color-coded bars make the current state instantly visible.
How to Read It
Five bar colors describe the trend state based on price position relative to Alpha and Beta.
- Bull Positive — price is above both lines and closing higher, strong uptrend
- Bull Negative — price is above both lines but closing lower, uptrend with pullback
- Bear Negative — price is below both lines and closing lower, strong downtrend
- Neutral — price is between Alpha and Beta, no clear trend direction
Practical Tips
The Cycle Period and ATR Period work together — the cycle component identifies directional bias while the ATR component sizes the adaptive bands. Shorter cycle periods react faster; longer periods catch larger moves. The two ATR multipliers control the width of the Alpha and Beta channels independently. Use on intraday charts with 1-tick data.
Requirements
- Can only be used on charts with a chart data type of 'Intraday Chart'
- Recommended 'Intraday Data Storage Time Unit' setting '1 Tick'
Input & Settings
| No. | Input Name | Function |
|---|---|---|
| 1 | Cycle Source | Specifies the data source for calculating the Cycle using the Rate of Change (ROC). This input determines which price data (like close, open, high, low) will be used for the ROC calculation to identify cyclical patterns. |
| 2 | Cycle Period | Specifies the period over which the Cycle (Price) is calculated. |
| 3 | ATR Period | Specifies the period over which the Average True Range (ATR) is calculated. |
| 4 | ATR Alpha | A multiplier applied to the ATR when calculating the first (Alpha) trend line. |
| 5 | ATR Beta | A multiplier applied to the ATR when calculating the second (Beta) trend line. |
Specifies the data source for calculating the Cycle using the Rate of Change (ROC). This input determines which price data (like close, open, high, low) will be used for the ROC calculation to identify cyclical patterns.
Specifies the period over which the Cycle (Price) is calculated.
Specifies the period over which the Average True Range (ATR) is calculated.
A multiplier applied to the ATR when calculating the first (Alpha) trend line.
A multiplier applied to the ATR when calculating the second (Beta) trend line.
Subgraphs
| No. | Subgraph Name | Function & Comments |
|---|---|---|
| 1 | Trend Zero Alpha Positive | Default: Line. Represents the positive side of the Alpha trend line. |
| 2 | Trend Zero Alpha Negative | Default: Line. Represents the negative side of the Alpha trend line. |
| 3 | Trend Zero Beta Positive | Default: Line. Represents the positive side of the Beta trend line. |
| 4 | Trend Zero Beta Negative | Default: Line. Represents the negative side of the Beta trend line. |
| 5 | Neutral | Default: Color Bar Candle Fill. Indicates the bars where the closing price is between the Alpha and Beta. |
| 6 | Bull Positive | Default: Color Bar Candle Fill. Indicates bars where the closing price is higher than the opening price, and the Alpha trend line is above the Beta trend line. |
| 7 | Bull Negative | Default: Color Bar Candle Fill. Indicates bars where the closing price is lower than the opening price, and the Alpha trend line is above the Beta trend line. |
| 8 | Bear Positive | Default: Color Bar Candle Fill. Indicates bars where the closing price is higher than the opening price, and the Alpha trend line is below the Beta trend line. |
| 9 | Bear Negative | Default: Color Bar Candle Fill. Indicates bars where the closing price is lower than the opening price, and the Alpha trend line is below the Beta trend line. |
Default: Line. Represents the positive side of the Alpha trend line.
Default: Line. Represents the negative side of the Alpha trend line.
Default: Line. Represents the positive side of the Beta trend line.
Default: Line. Represents the negative side of the Beta trend line.
Default: Color Bar Candle Fill. Indicates the bars where the closing price is between the Alpha and Beta.
Default: Color Bar Candle Fill. Indicates bars where the closing price is higher than the opening price, and the Alpha trend line is above the Beta trend line.
Default: Color Bar Candle Fill. Indicates bars where the closing price is lower than the opening price, and the Alpha trend line is above the Beta trend line.
Default: Color Bar Candle Fill. Indicates bars where the closing price is higher than the opening price, and the Alpha trend line is below the Beta trend line.
Default: Color Bar Candle Fill. Indicates bars where the closing price is lower than the opening price, and the Alpha trend line is below the Beta trend line.
Get Access to Every Study
All studies are included with the Gold License — proprietary Sierra Chart tools, Discord community access, and the full AMT framework.
Get the Gold License — $125/mo