AMT Delta Surge
Sudden delta shift detection between consecutive bars
Identifies sudden shifts in delta percentage between consecutive bars using dual-gate filtering. Both the change from the previous bar and the current bar's absolute delta must exceed their thresholds, plus a minimum volume requirement — ensuring signals represent genuine conviction shifts, not noise.
The Concept
A delta surge occurs when the character of order flow changes abruptly between consecutive bars — a sudden shift from passive to aggressive participation. These transitions often mark the start of a new move as fresh directional conviction enters the market. Delta Surge detects these moments using multiple confirmation filters to separate genuine shifts in order flow from routine noise.
How to Read It
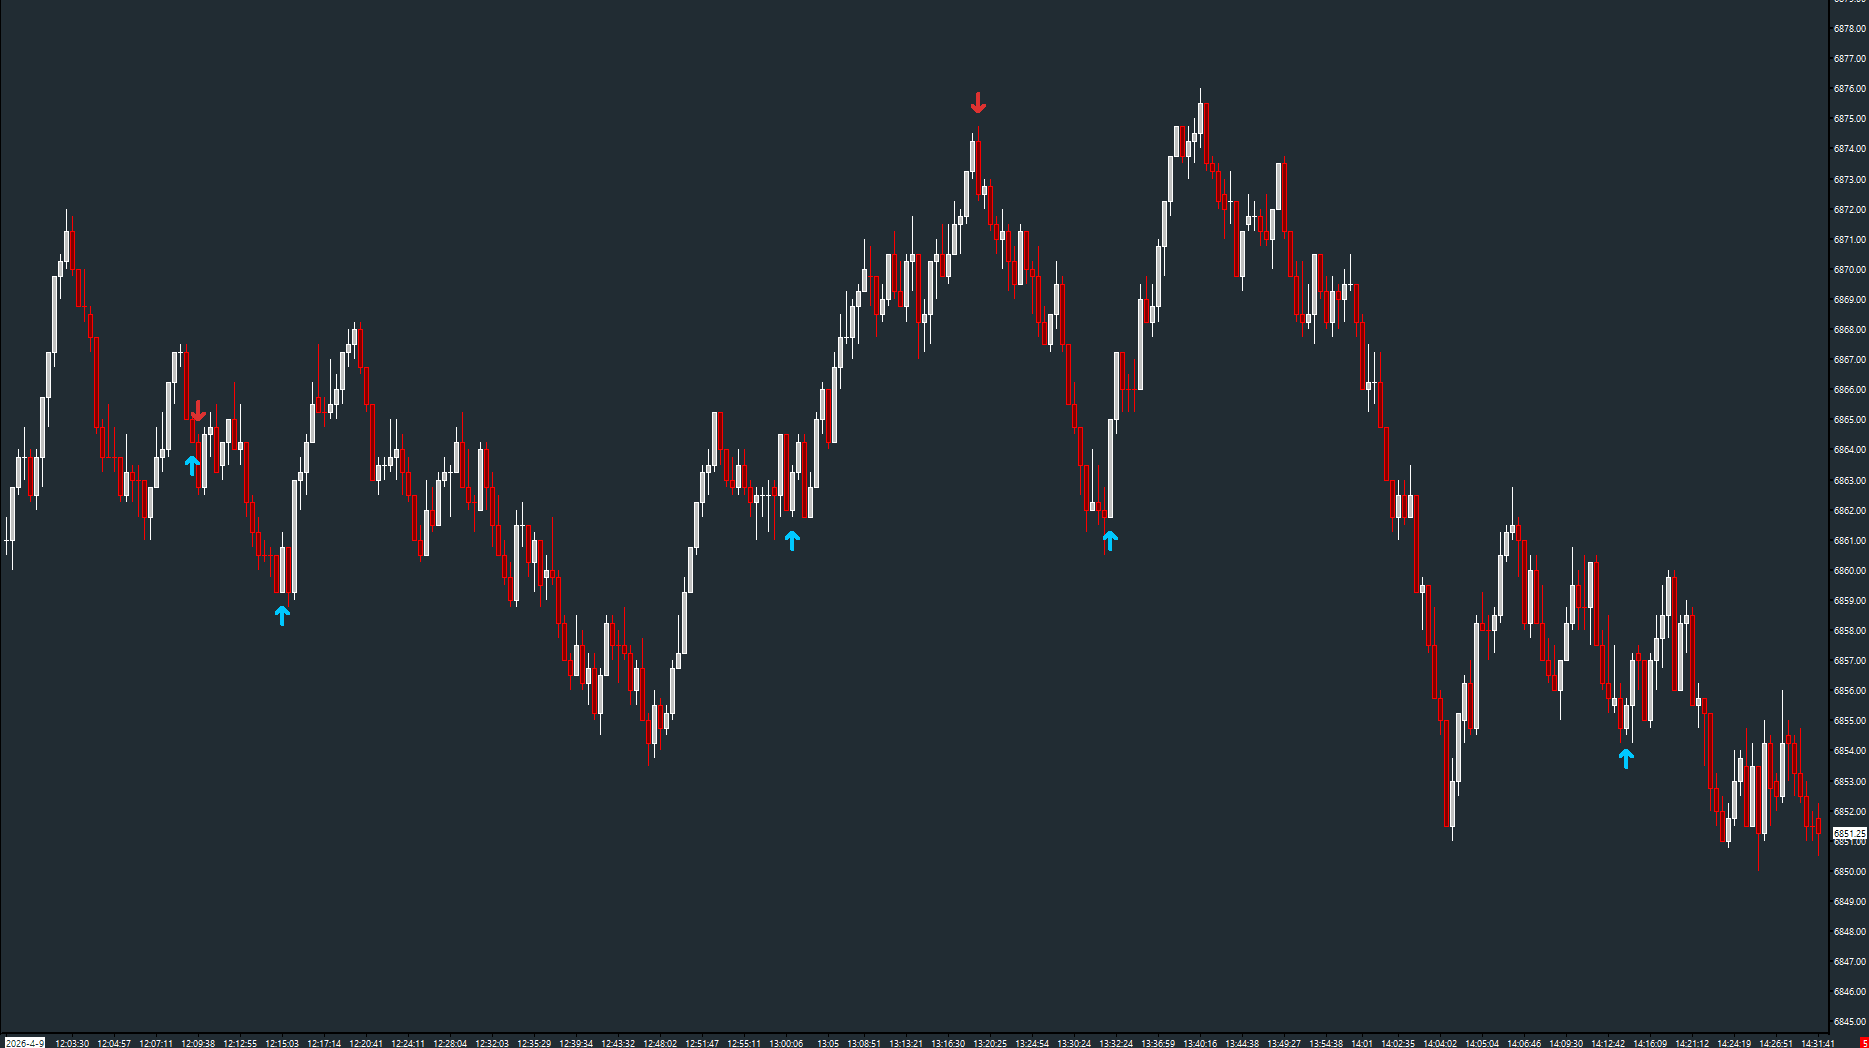
Arrows appear on bars where sudden delta shifts are detected.
- Cyan up arrow = sudden bullish shift — delta swung positive with conviction
- Red down arrow = sudden bearish shift — delta swung negative with conviction
- Surges at key support/resistance levels suggest aggressive order flow commitment
- Multiple surges in the same direction confirm a developing trend
Practical Tips
The study uses multiple configurable filters that work together to separate real surges from noise. Start with the defaults for ES and adjust based on your instrument's typical activity. Lower the thresholds for more signals, raise them for only the most dramatic shifts.
Input & Settings
| No. | Input Name | Function |
|---|---|---|
| 1 | Min Change from Previous (%) | Minimum absolute change in delta percentage between consecutive bars. Default: 50. Range: 10–100. |
| 2 | Min Current Delta (%) | Minimum absolute delta percentage on the current bar. Default: 15. Range: 1–100. |
| 3 | Min Volume per Bar | Minimum total volume per bar before evaluating for surges. Default: 100. Range: 1–100000. |
Minimum absolute change in delta percentage between consecutive bars. Default: 50. Range: 10–100.
Minimum absolute delta percentage on the current bar. Default: 15. Range: 1–100.
Minimum total volume per bar before evaluating for surges. Default: 100. Range: 1–100000.
Subgraphs
| No. | Subgraph Name | Function & Comments |
|---|---|---|
| 1 | Surge Up | Default: Arrow Up. Marks bars with a sudden bullish delta shift. Cyan. |
| 2 | Surge Down | Default: Arrow Down. Marks bars with a sudden bearish delta shift. Red. |
Default: Arrow Up. Marks bars with a sudden bullish delta shift. Cyan.
Default: Arrow Down. Marks bars with a sudden bearish delta shift. Red.
Free with the AMT Toolkit
This study is part of the AMT Toolkit — a free collection of Sierra Chart studies for orderflow, market structure, and chart utilities.
Get the AMT Toolkit — Free