
FREE LESSON + MORNING CHECKLIST
Learn the Balance Method.
Start with one chart.
Learn where price is, which areas to watch, and how to read the response. Watch the short explanation, explore a real chart, and use the checklist for your next review.
Free to read, watch, and download. No signup or charting-platform account required for this lesson.
01 / UNDERSTAND THE MAP
Location first.
Response second.
Balance is a reference for reading price within the timeframe you selected. The surrounding zones identify areas to watch as price moves. The Zone Map adds potential paths and historical context.
Reach describes how often price arrived at a zone in a matching historical scenario. Reaction describes its behavior there. Neither percentage is a trade win rate.
Watch the narrated example, then use the real chart below to connect the ideas.
1:33 narrated map example. The animation illustrates historical context; it is not a live feed.
02 / READ ONE REAL CHART
Find the open. Follow the areas. Read the response.
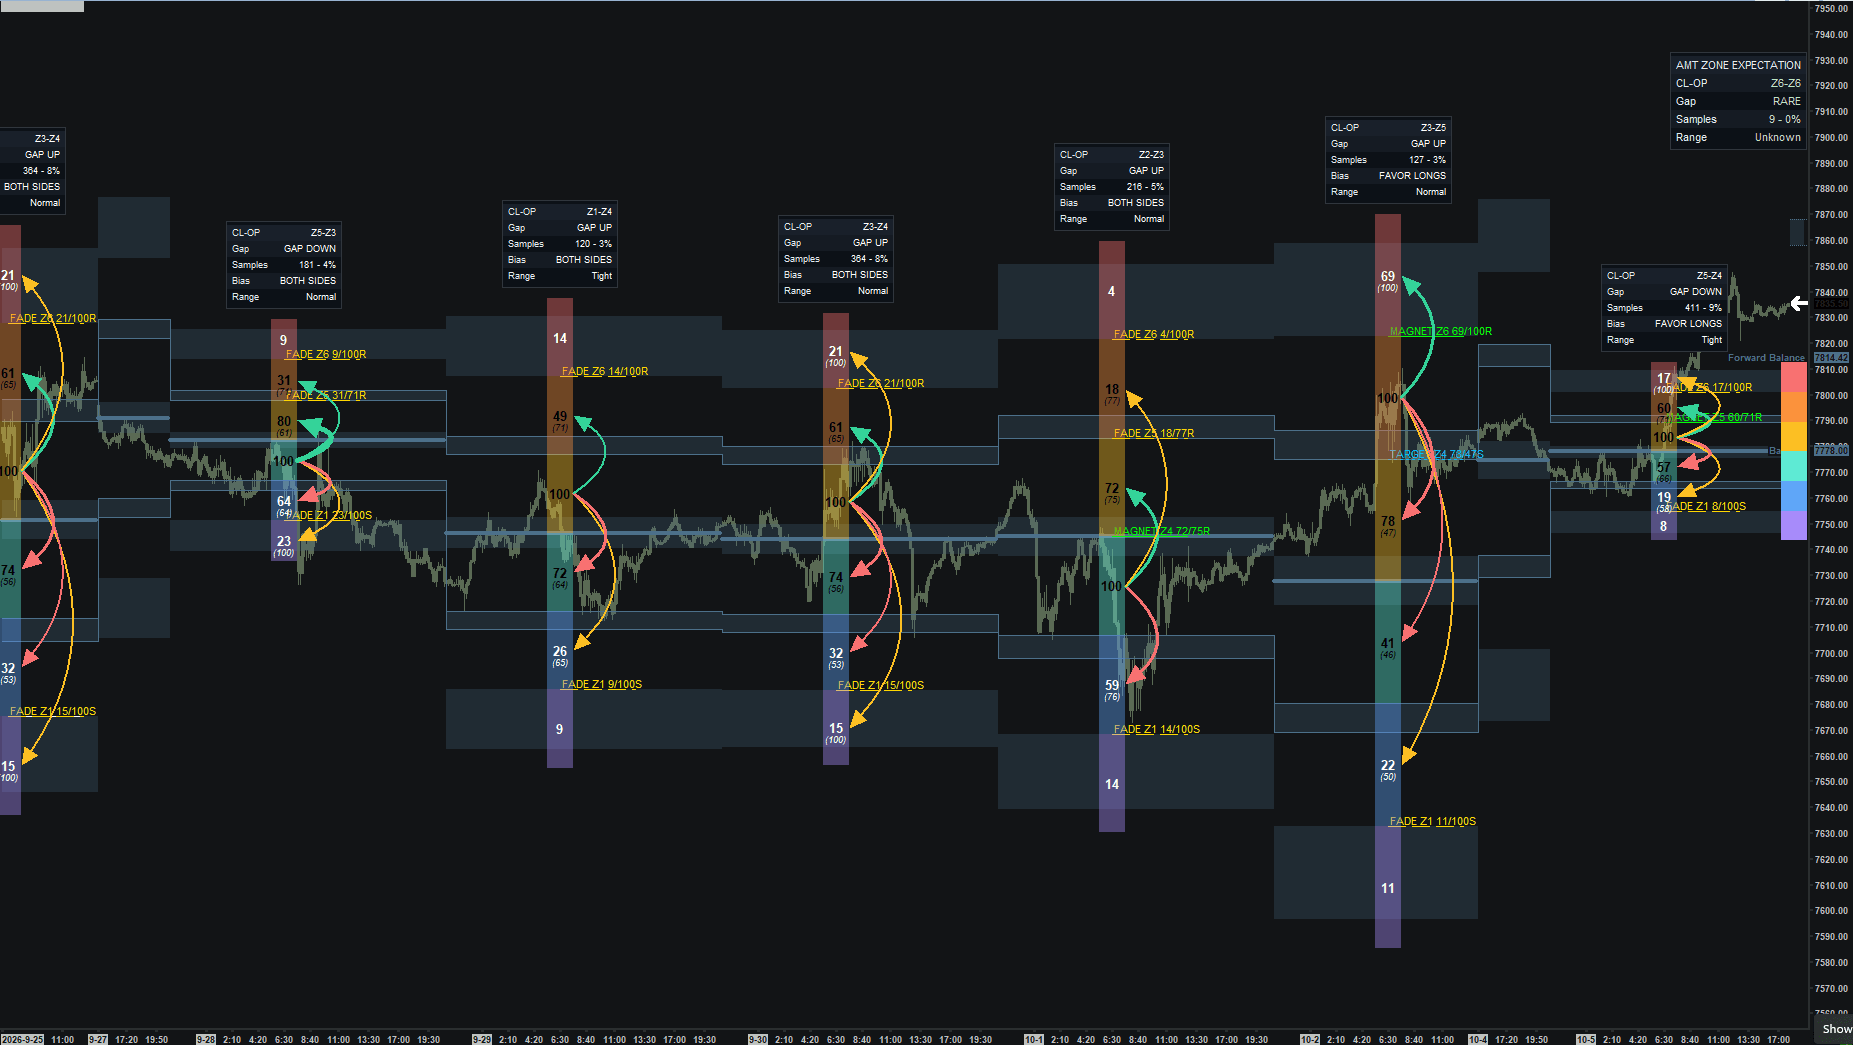
Select the numbered notes to read this saved Sierra Chart session. Start with its opening context, identify the nearby zones, then compare the subsequent price path.
A FIRST READ
Read the opening context
The session summary shows the close-to-open zones, gap, sample count, bias, and range. This saved session shows a gap up with BOTH SIDES context. Use it as a starting point for reading the map, not an instruction to enter a trade.
An actual chart example. The animated hero chart uses illustrative data.
The notes explain a chart read. They do not mark trade entries, stops, or results. The relevant timeframe and your own setup rules still matter.
03 / MAKE THE READ YOUR OWN
Write down what you see before what you expect.
During a chart review or replay, pause at a zone test. Write three sentences: where price is, what it has done at the area, and what would change your interpretation. Then reveal the next part of the chart and compare.
LocationWhich zone and which timeframe am I reading?
EvidenceWhat has price actually done at this area?
DecisionDoes this meet my own setup rules, or should I wait?
Keep examples that disagree with your expectation as well as those that fit. Reaching a zone is useful context; it does not, by itself, tell you to enter a trade.
TAKE IT TO YOUR NEXT REVIEW
Your Balance morning checklist.
Use the same questions each session. Prepare the context first, then save your observations for review. The downloadable version has space for your chart details and notes.
Confirm the context.
Name the instrument, session, time zone, and timeframe you are reading. Check that the chart settings match your review.
Locate price.
Identify Balance and the nearest zones above and below price. Name the view: Daily, Weekly, Zone, or another selected timeframe.
Describe the sequence.
Is price moving back toward Balance, extending outward, or still undecided? Record what you can observe before choosing a direction.
Plan alternatives.
Write what would support continuation and what would support a return. A zone touch alone does not qualify a trade.
Define what changes your read.
Record the observation that would contradict your interpretation. Keep historical reach separate from reaction; neither is a trade win rate.
Apply your own decision limits.
Use your tested setup and risk rules, including invalidation and an exit plan. Set your session cutoff. Waiting is a valid decision.
Save and review.
Save the chart and your reasoning before seeing the outcome. Later, review the process, including failed expectations and decisions to wait.
Printable PDF · Free download · Educational preparation, not trade signals.
KEEP LEARNING
Go deeper at your own pace.
Continue into the full Balance guide for timeframe context, rotation, extension, and practice scenarios.
Continue to the full Balance guide →This lesson and checklist are free education. Gold provides the paid Sierra Chart studies and member chartbooks. The free Toolkit is a separate collection and does not include the paid Balance + Zone Map. Explore all free resources →