
TRADINGVIEW · Read the broader map
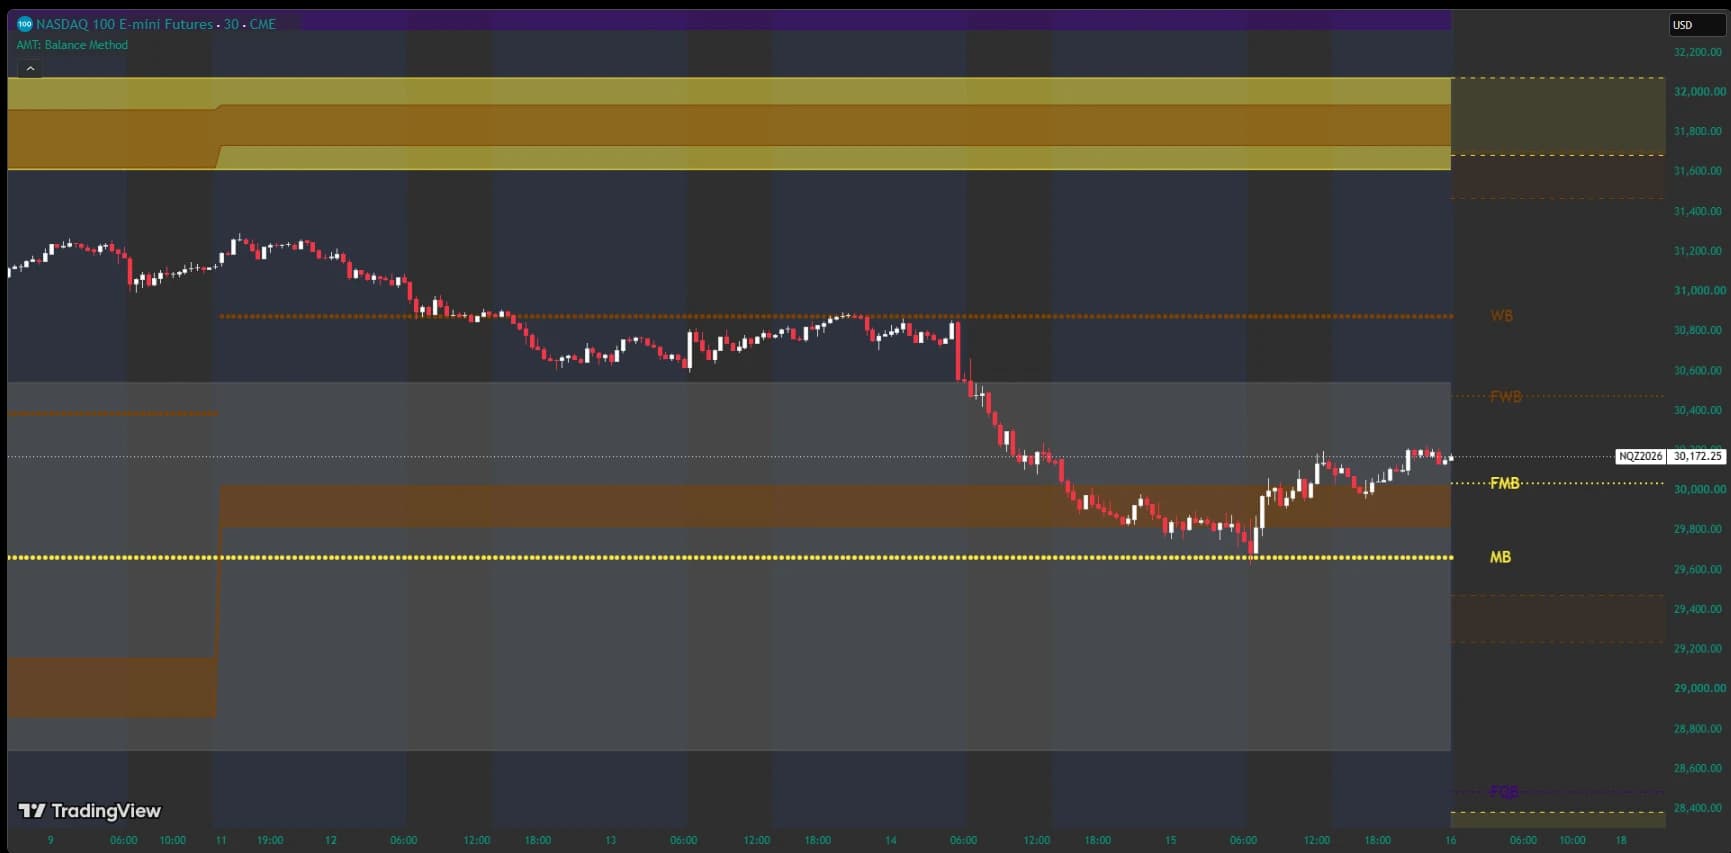
AMT Balance Method
Compare fixed and developing weekly, monthly, quarterly, and yearly Balance levels with upper and lower Dyno zones.
AMT ON TRADINGVIEW
Five indicators for understanding Balance, session structure, historical reference rates, and breakout workflows. Explore the chart, learn the rules, and follow the supporting research where available.
Each indicator links to its published TradingView page for current access information. TradingView access is separate from the Sierra Chart + Tradrr membership. Platform subscriptions and market-data requirements are separate.
Compare fixed and developing weekly, monthly, quarterly, and yearly Balance levels with upper and lower Dyno zones.
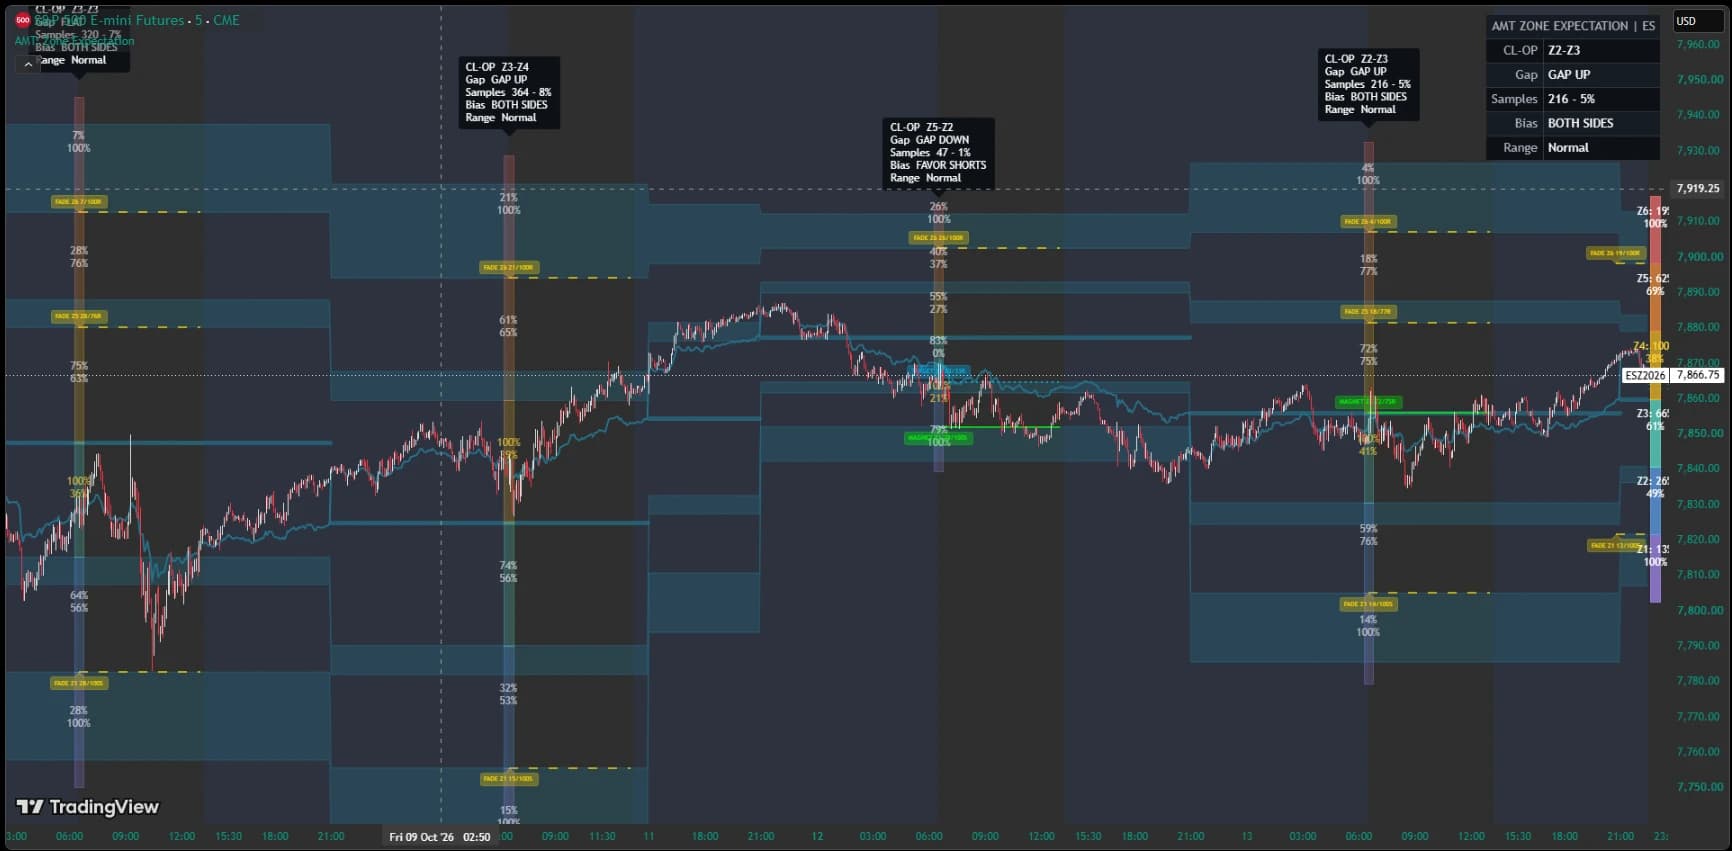
Place ES and NQ in a six-zone session map with embedded historical reach rates, reaction rates, and sample counts.
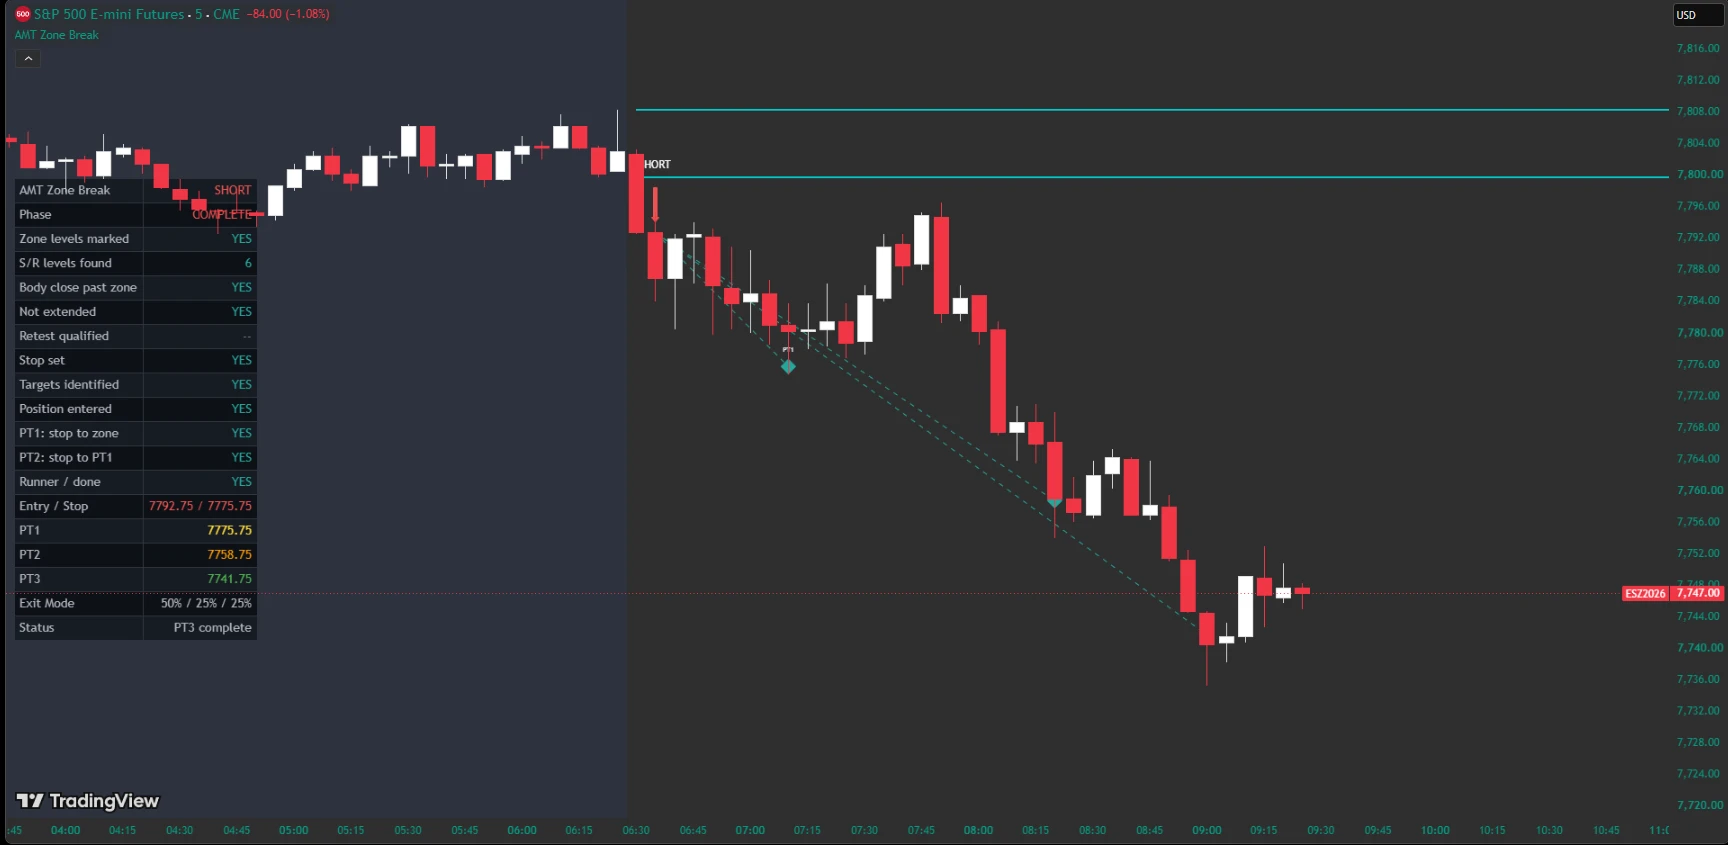
Track confirmed zone breaks, entry qualification, simulated entries, stops, and target management through an on-chart checklist.
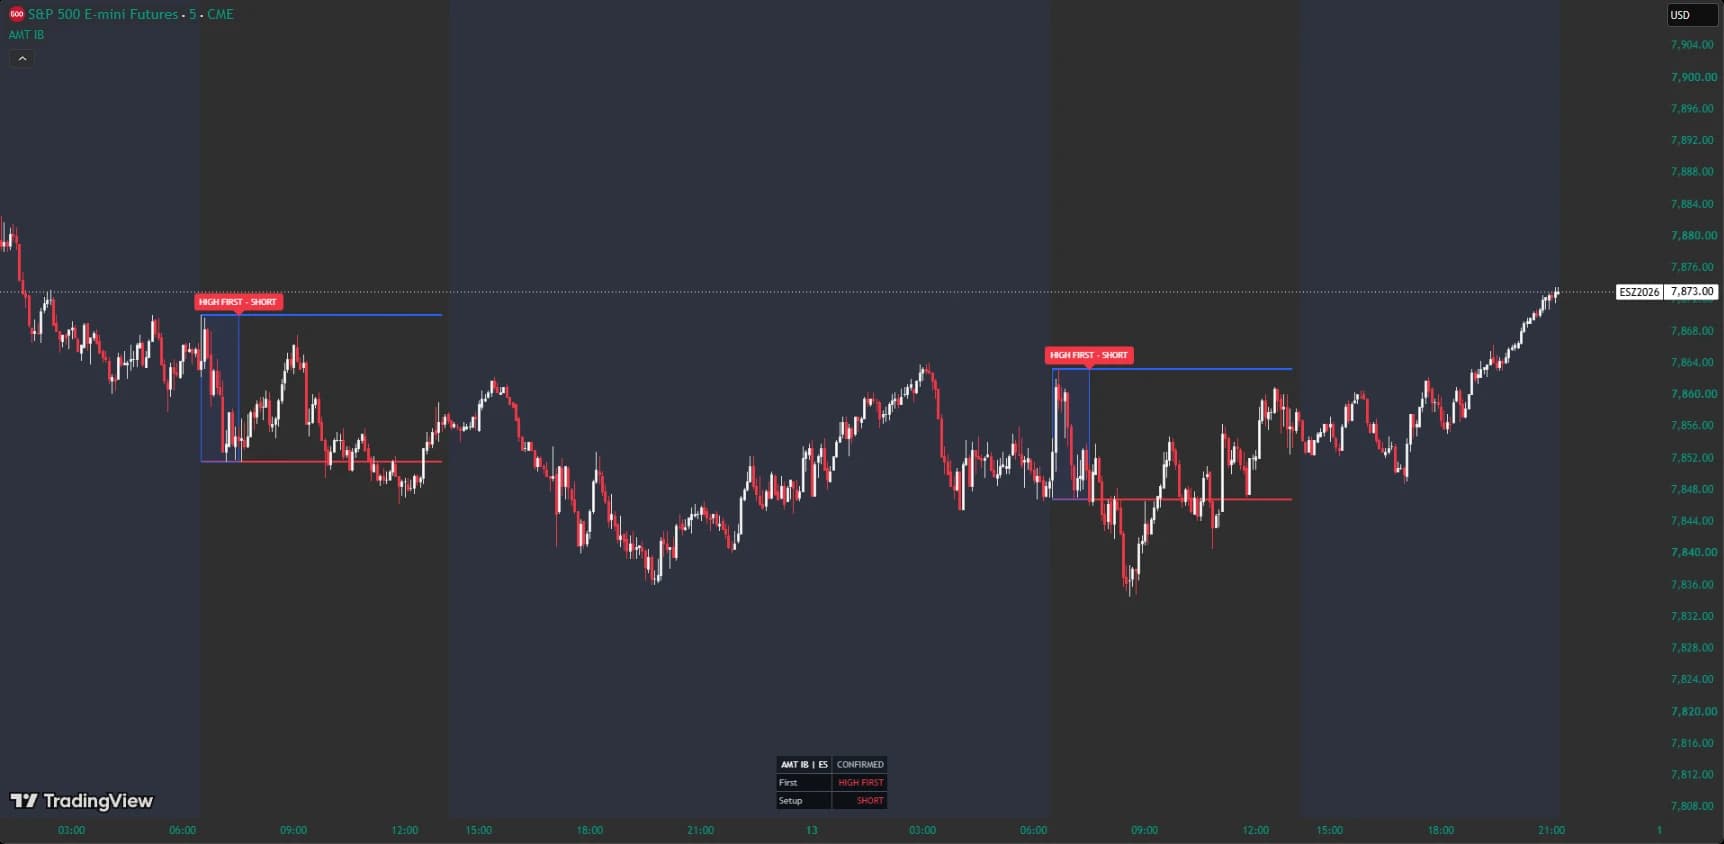
See the first-hour high and low, which final extreme formed first, and the developing or confirmed directional classification.
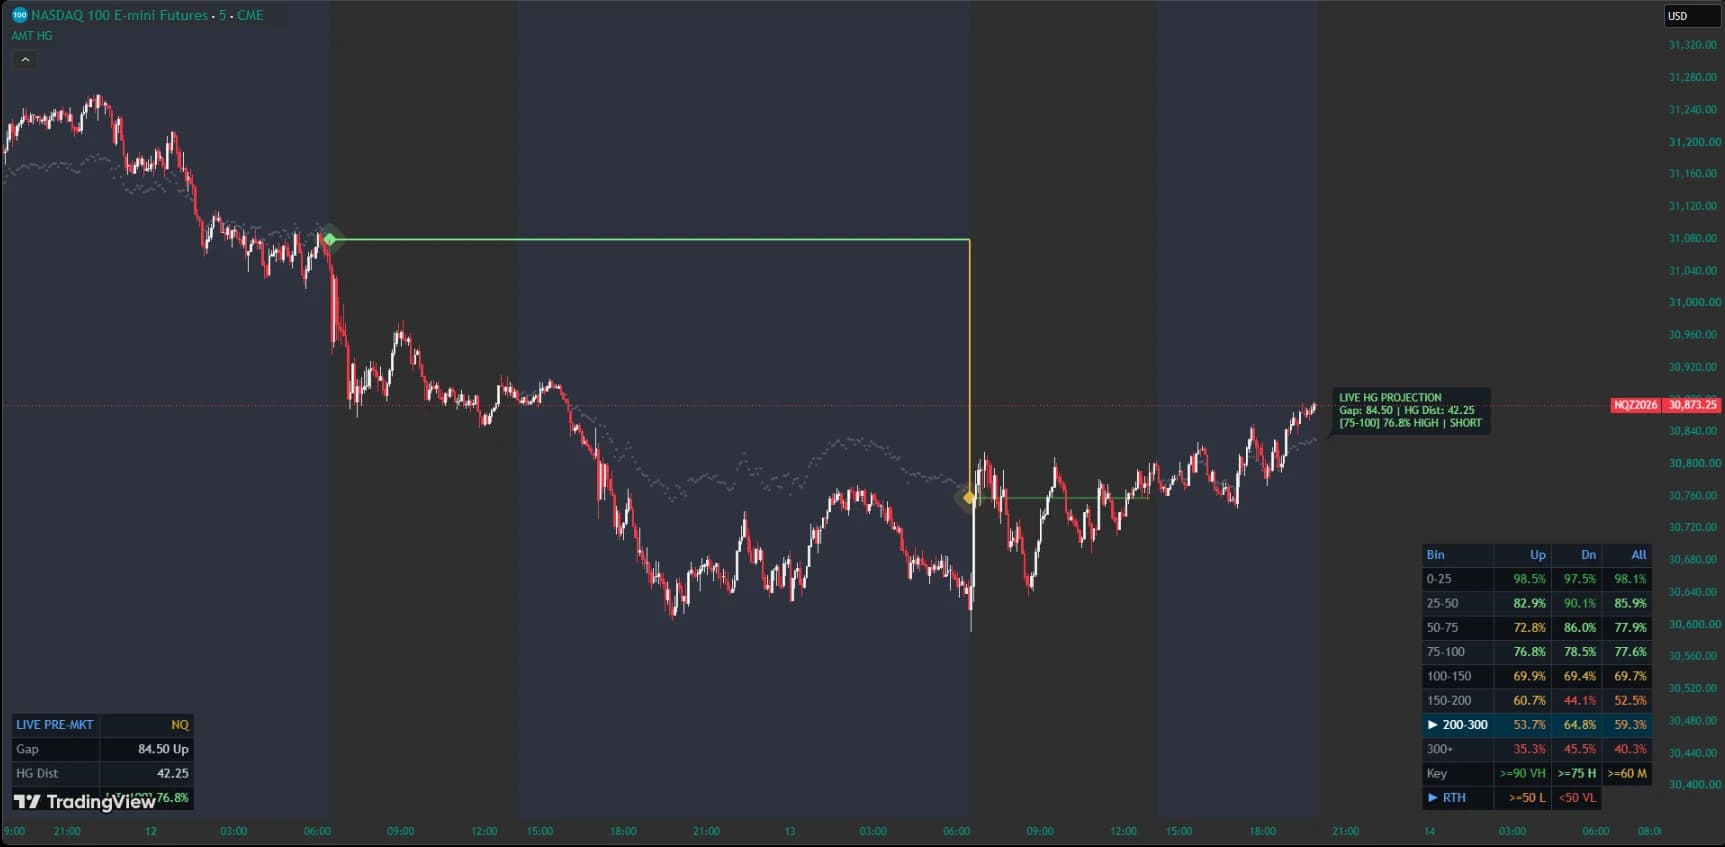
Plot the midpoint between the prior regular-session close and current open, with historical reference rates by gap size and direction.