
Balance
The reference for reading where price sits within the market structure. Start with the area around Balance, then look at the surrounding zones.
START HERE
Start with Balance and the Zone Map. Learn what you are looking at, get the essentials on your chart, then follow one setup at a time.
UNDERSTAND THE ESSENTIALS
The reference for reading where price sits within the market structure. Start with the area around Balance, then look at the surrounding zones.
The historical frequency of price reaching another zone under a matching close and open scenario. It describes a destination, not a trade win rate.
What price historically did when it reached that area. Keep the likelihood of reaching a level separate from its behavior once there.
CHOOSE YOUR PLATFORM
One AMT Gold membership includes both platform offerings. Choose the instructions for the platform you use.
Chartbooks and the other Sierra Chart studies do not transfer to TradingView.
Compare membership access →Read the guide and chart example first. The free Sierra Chart Toolkit and Trade Journal are also available.
PUT THE PIECES TOGETHER
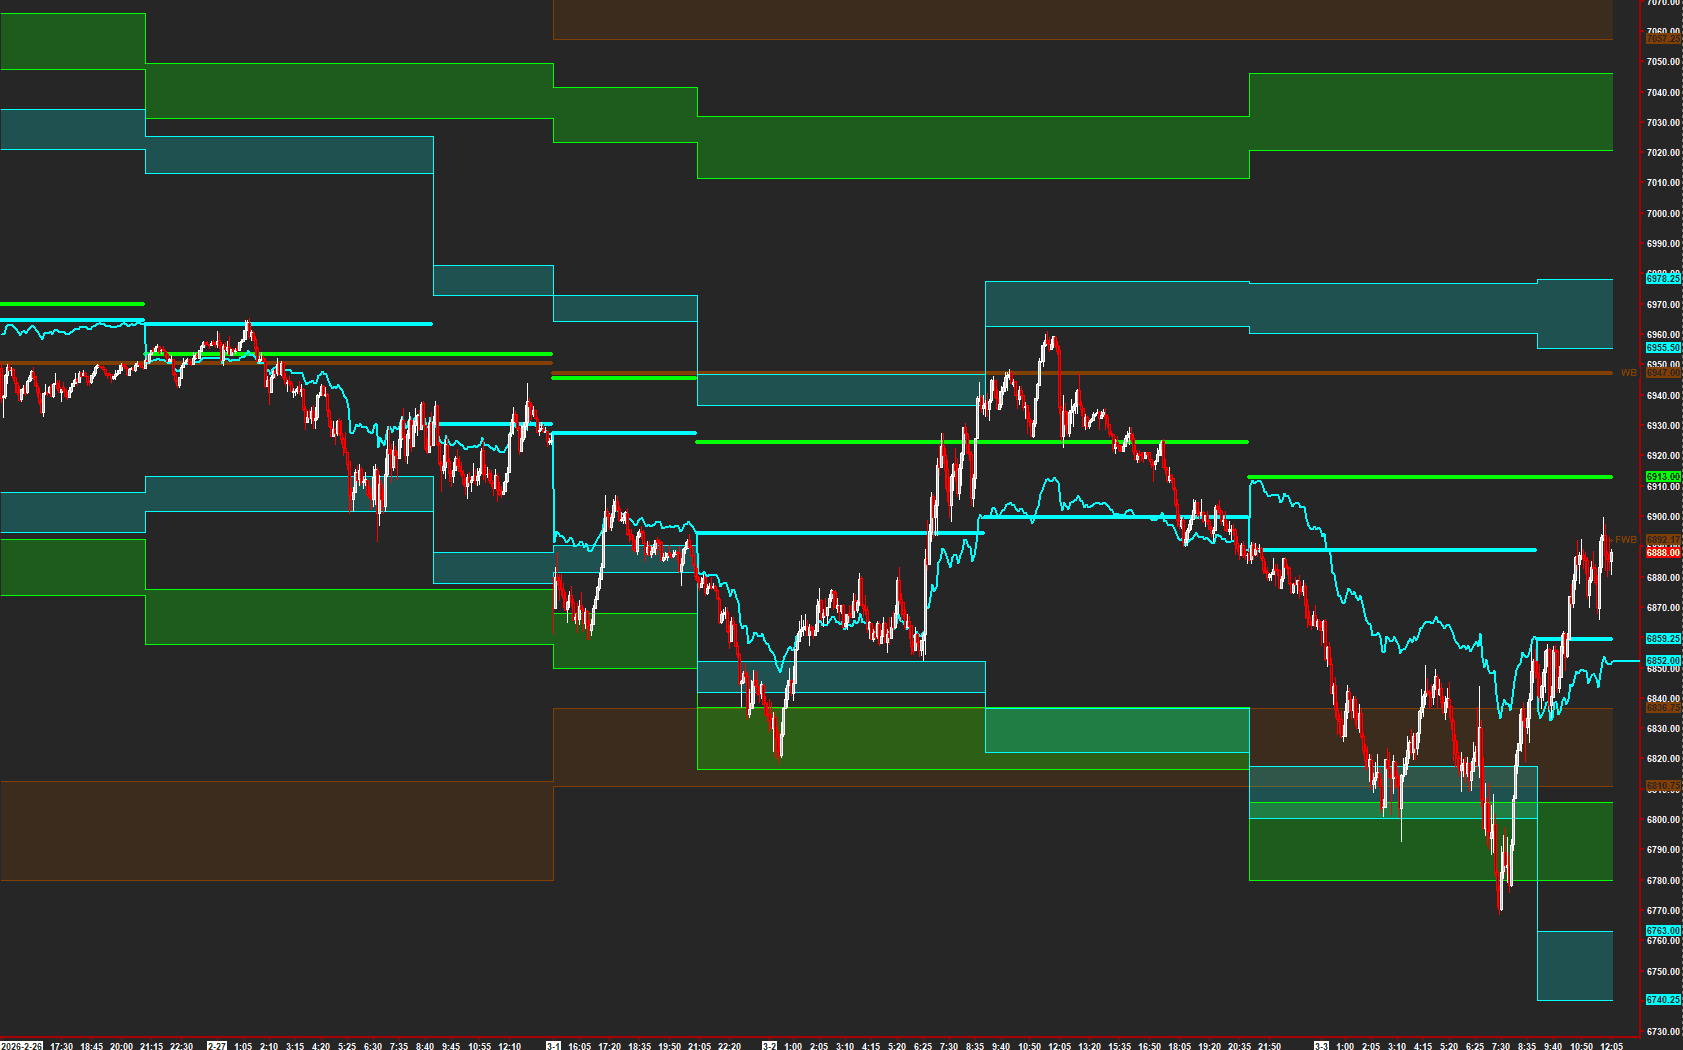
Select the numbered notes to locate the references, observe price at a zone, and keep the next area in view.
A FIRST READ
Start with the horizontal references and the colored areas around them. Find Balance for the timeframe you are reading before deciding where price sits in the bigger picture.
A static chart example. The animated framework demos on the homepage use illustrative data.
BUILD YOUR ROUTINE
See how I use Balance and the Zone Map through the morning. AMT Zone Break is a standalone setup using AMT Zone levels, separate from Reach and Reaction: one trade per day for that setup, with no re-entry. Explore Half Gap and IB Extreme as well. Each overview explains the markets, timing, and tools involved.