
TRADINGVIEW · Read the broader map
AMT Balance Method
for TradingView.
Compare fixed and developing weekly, monthly, quarterly, and yearly Balance levels with upper and lower Dyno zones.
See the published script for current access information. Platform subscriptions and data requirements are separate.
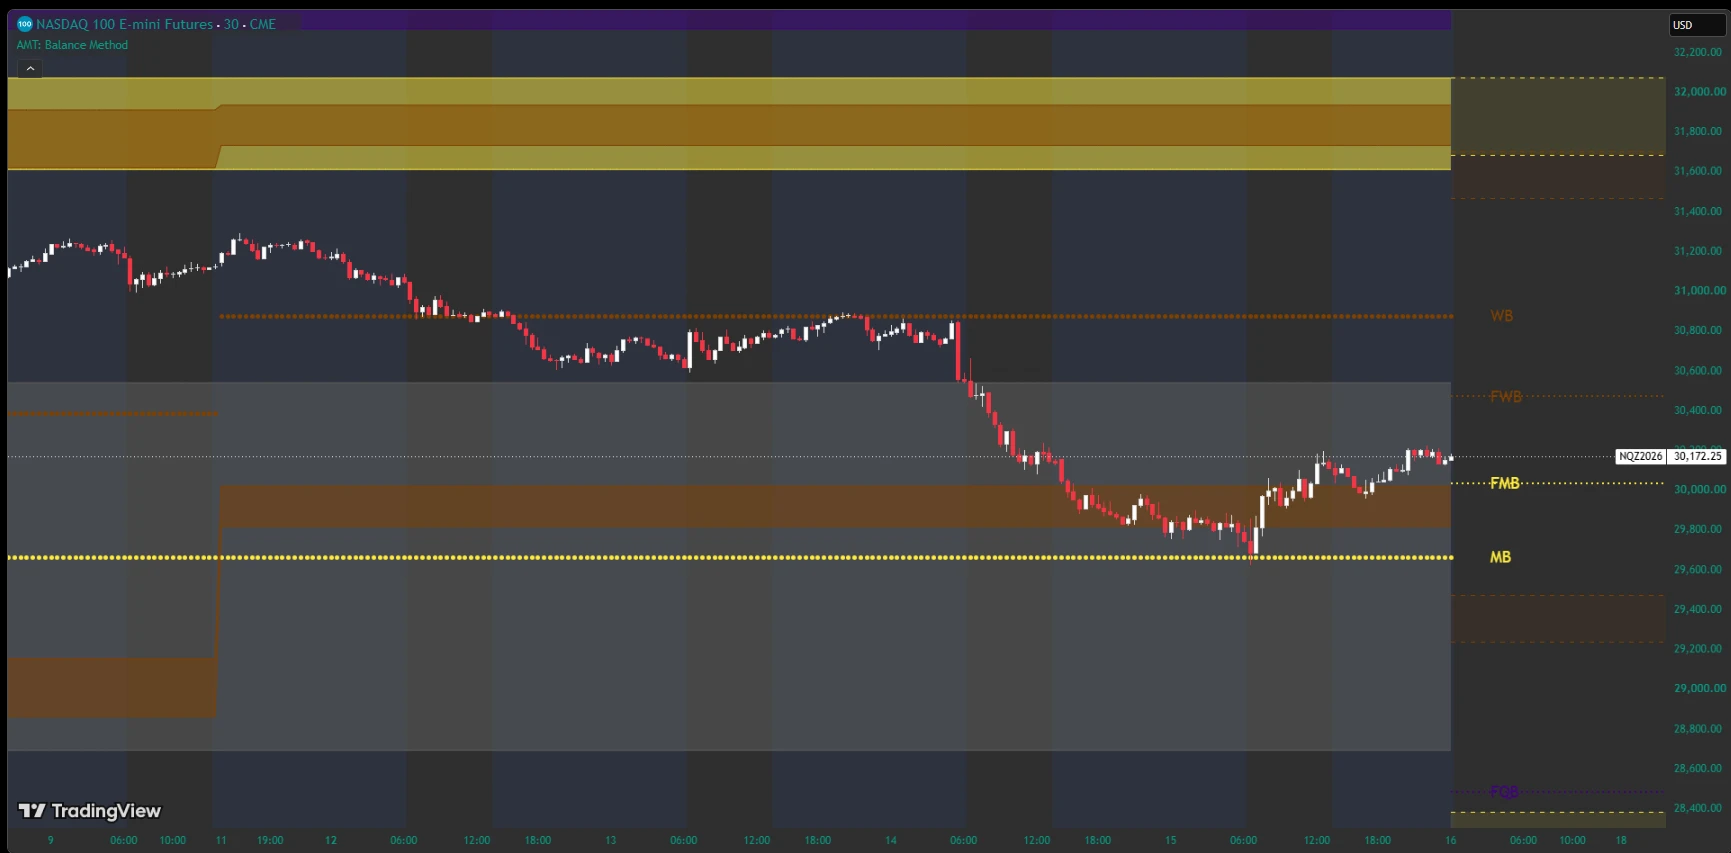
An established map beside a developing one
Regular Balance and Dyno levels use completed periods and remain fixed until the next period begins. Live levels respond to the current period, including the open chart bar. Comparing them helps describe where price sits across time horizons; the indicator does not assign probabilities or trade signals.
Read the labels
WB, MB, QB, and YB identify fixed weekly, monthly, quarterly, and yearly Balance. FWB, FMB, FQB, and FYB label developing Balance extended to the right. Upper Dyno spans R1 to R2; Lower Dyno spans S1 to S2. These are price-derived references, not a volume profile.
Choose what stays visible
Control static Balance, static Dynos, live Balance history, and forward projections independently for each timeframe. Live Balance History is off by default. Projection length changes only the visual extension: it does not forecast price or finalize the next period’s levels.
Chart setup
Use standard time-based candles, the intended trading session, and sufficient history, especially for yearly levels. A chart interval greater than a reference timeframe hides that reference: a monthly chart, for example, hides weekly levels. Session selection and missing history can change what is displayed.