
 Open full-size chart ↗
What it shows
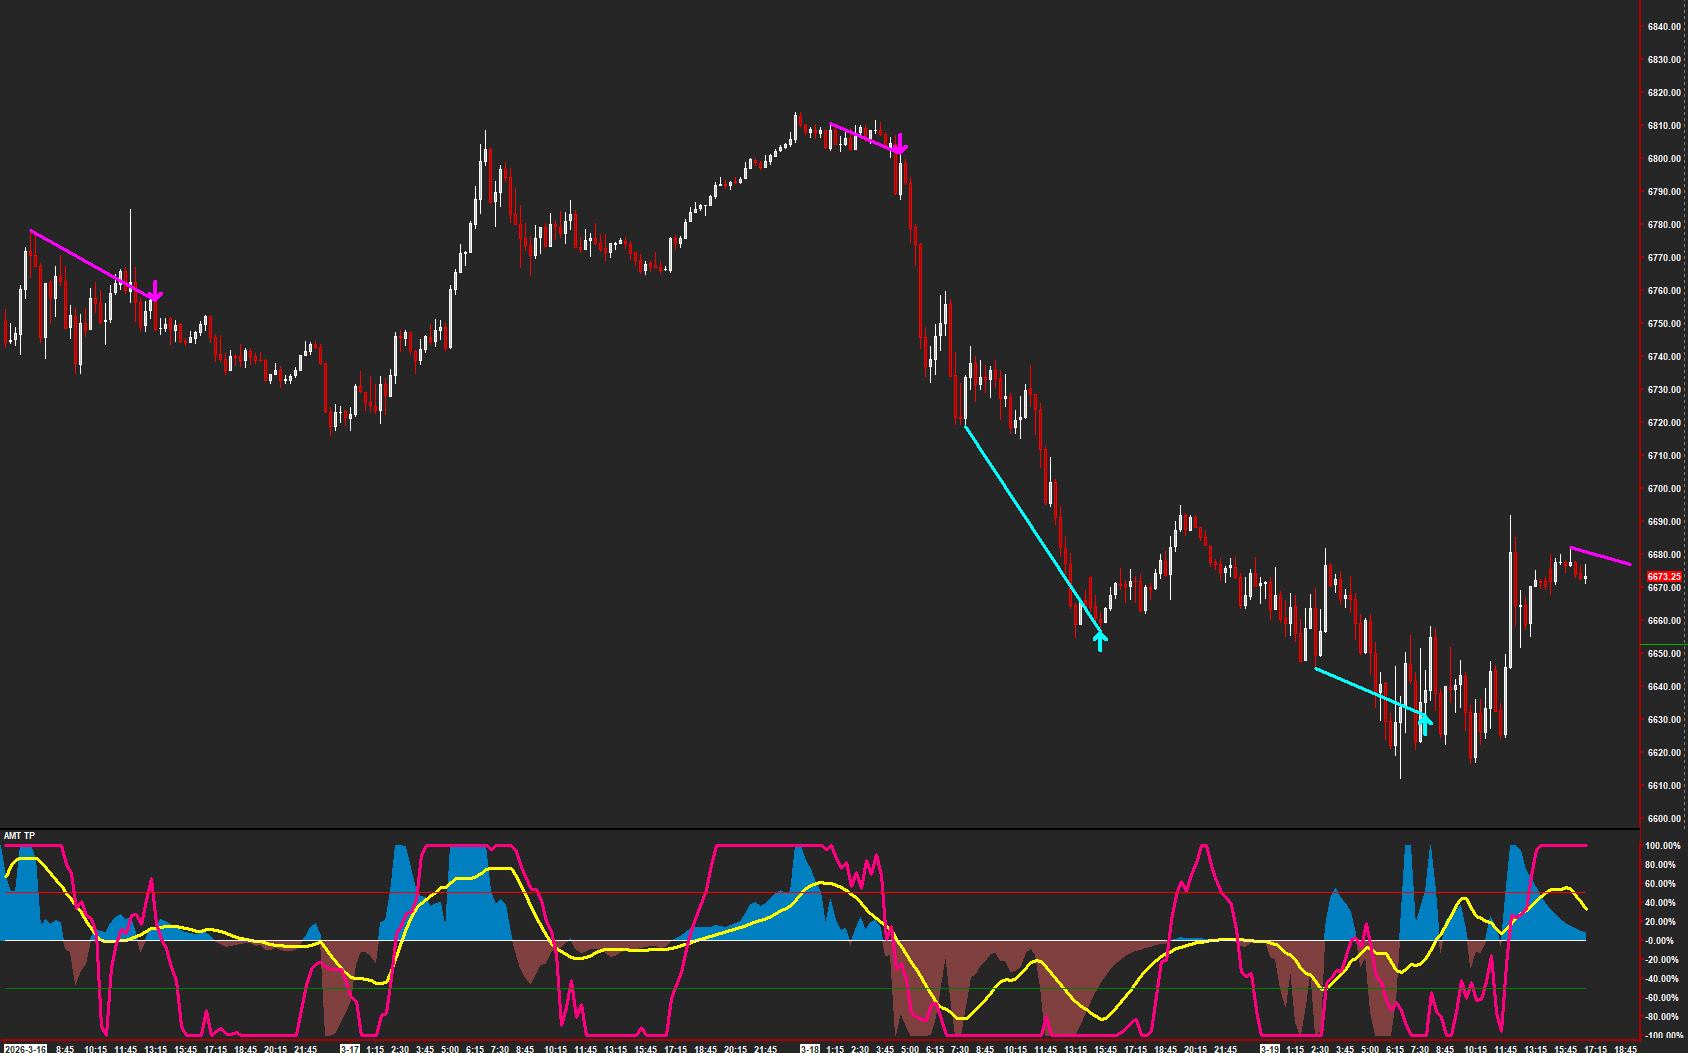
Price-Osc Divergence marks relationships between price swings and a selected oscillator, with optional developing warnings and filters.
How to read it
- Check which oscillator subgraph is selected.
- Distinguish warning markers from confirmed divergence markers.
- Compare the connected swings and subsequent price response.
Settings that matter
Review source selection, pivot sensitivity, regular and hidden pattern visibility, and warning display. If using confluence or Balance filters, verify the referenced studies.
An example to review
A warning appears while a swing is still forming. Follow whether it confirms or changes, then compare that sequence with price at your planned level.
Illustrative reading example, not a recorded trade or performance claim.
What to keep in mind
Developing warnings can change. Confirmed pivots may require later bars, and divergence does not guarantee a reversal or continuation.
Use the current AMT study on Sierra Chart. Confirm the symbol, chart type, session settings, and available data before comparing examples. Platform and market-data fees are separate.