
Sierra Chart / Paid Order Flow
See the setup.
Track the response.
Review the history.
Explore 17 studies for pressure, price response, and retests. Selected studies track confirmed events and what followed in your loaded chart history.
Full Sierra Chart suite + community and learning. Balance on Tradrr at launch. TradingView included for the purchased term when bought before Nov 1, 2026.
Find your study
17 of 17 studies
AMT Auction Delta Flow
Did the auction fail, reject, or continue?
Historical event trackingRead the guide →Pressure and responseAMT Auction Delta Flow — Delta Pane
How does rotation delta compare with price?
Read the guide →Zones and retestsAMT Absorption & Retest
Did the first absorption retest hold?
Historical event trackingRead the guide →Zones and retestsAMT POC Acceptance & Retest
Was the POC area accepted or rejected?
Historical event trackingRead the guide →Zones and retestsAMT Reaction Zones & Retest
Did the retracement zone hold on return?
Historical event trackingRead the guide →Pressure and responseAMT Delta Efficiency & Response
Did aggressive pressure produce price progress?
Historical event trackingRead the guide →Footprint structureAMT Taper Volume & Rejection
Did the taper lead to rejection and a hold?
Historical event trackingRead the guide →Footprint structureAMT Unfinished Auction & Return
Did price return to the unfinished extreme?
Historical event trackingRead the guide →Footprint structureAMT Stacked Imbalance & Defense
Was the imbalance zone defended?
Historical event trackingRead the guide →Pressure and responseAMT Delta Surge & Follow-Through
Did the delta surge continue or fail?
Historical event trackingRead the guide →Tape and contextAMT Tape Signals
Where did trading activity accelerate?
Read the guide →Pressure and responseBid and Offer Efficiency
Which side accounts for more traded volume?
Read the guide →Tape and contextTick Delta
How many trades accumulated in this candle run?
Read the guide →Pressure and responseTick Delta 2.0
How much delta accumulated before its sign changed?
Read the guide →Tape and contextNADRO VWAP
Where is price relative to volume-weighted references?
Read the guide →Tape and contextPace of Tape
Is recent trading activity speeding up?
Read the guide →Tape and contextVol Based Momentum
Is volatility-based momentum improving?
Read the guide →See the display options
The detailed tables and historical labels help you verify, study, and learn how price reacted. Compact and detailed views are shown together here for comparison. Use the study display settings to show or hide supported after-reaction details; once familiar with the levels, keep your live trading chart as clean as you prefer. Historical observations are not trade win rates.
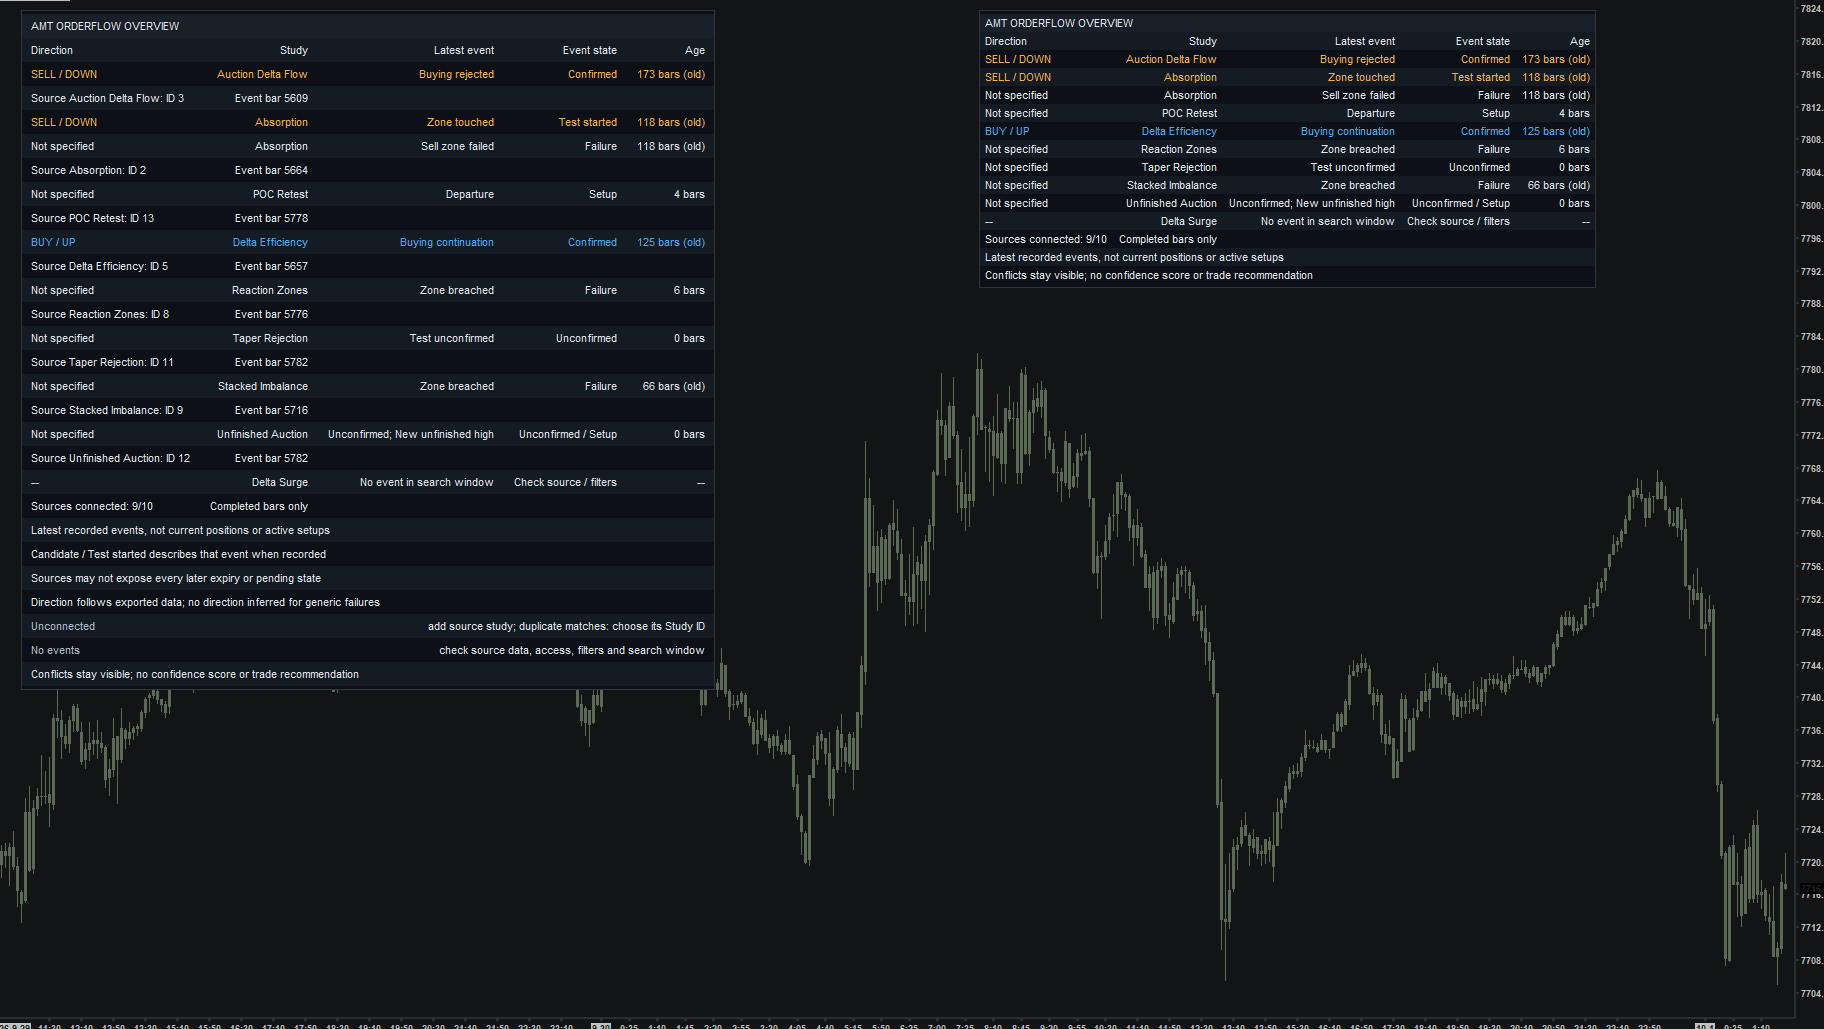 Open full-size chart ↗
Free vs paid: what changes?Compare 8 study families
Free Toolkit / Paid Order Flow
What does Order Flow add?
The paid studies extend the analysis from a pattern or display into a defined event sequence: what formed, what confirmed, how the return behaved, and what followed in the loaded history.
The Toolkit remains useful on its own. These are specific counterparts with different analysis rules, rather than identical signals with more features switched on.
| Study family | Free Toolkit | Paid Order Flow adds |
|---|---|---|
| Unfinished Auction | Marks completed-bar highs and lows where bid and ask volume meet the per-side minimum. | Tracks departure, first return, rejection or acceptance through the level, and historical return observations. |
| Delta Surge | Flags changes in delta share using change, current-delta, and volume thresholds. | Separates directional surges from easing pressure, adds a prior-volume baseline, and tracks later continuation, failure, expiry, and post-confirmation movement. |
| POC Per Bar | Plots each bar's highest-volume price and a moving average to show POC migration. | Builds POC cluster zones and follows departure, actual retest, volume-backed acceptance, rejection, and close-through outcomes. |
| Taper Volume | Highlights qualifying declines in footprint volume toward bar extremes. | Separates taper candidates from later rejection confirmation, creates zones, and tracks subsequent tests, holds, breaches, and historical observations. |
| Reaction Zones | Displays retracement reaction areas derived from rotations. | Uses frozen zones from confirmed rotations and records departure, actual-touch tests, holds, breaches, expiry, and earlier holds that precede a later failure. |
| Delta Efficiency | Displays smoothed bid/offer efficiency, a midpoint, and references from the previous efficiency run. | Retains an efficiency-line view and adds pressure/price-response analysis, candidate filters, later-close confirmation, and historical movement outcomes. |
| Absorption Zones | Finds footprint delta clusters, requires initial rejection, and draws zones with invalidation and optional expiry. | Adds cluster-quality filters and a first-retest lifecycle, including in-zone delta and reaction-close requirements for a hold, with hold/failure history. |
| Auction Flow | Colors candles to highlight order-flow states such as dominance, exhaustion, and absorption. | Adds rotation-level delta context, confirmed failed-auction/rejection/continuation events, optional level filtering, and historical outcome observations. |
Historical summaries describe observed events and movement under your settings. They are not trade win rates. Added tracking does not guarantee more accurate signals or profitable trades.