
 Open full-size chart ↗
What it shows
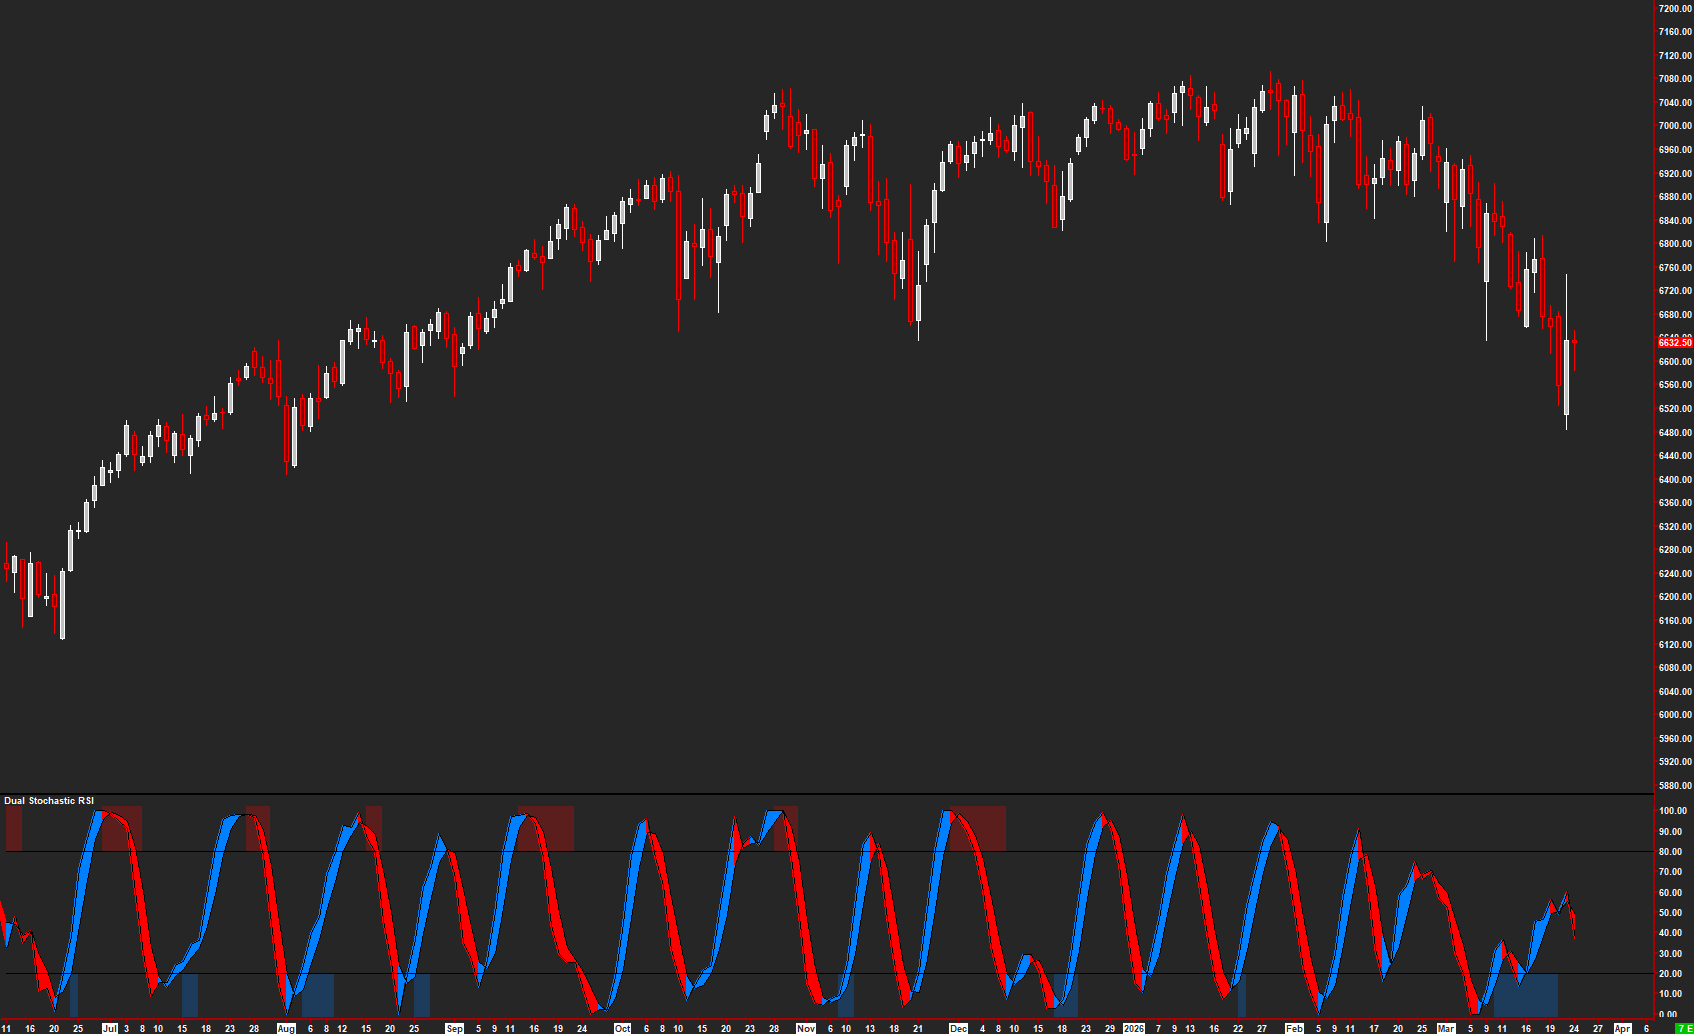
Dual Stochastic RSI displays two configurable momentum readings in a separate region, allowing you to compare their behavior.
How to read it
- Check which lines belong to each reading.
- Notice when the readings agree and when one turns while the other remains unchanged.
- Read upper and lower zones in the context of the price trend.
Settings that matter
Review each set of RSI and Stochastic controls independently. Check zone levels, colors, and any selected study references before comparing charts.
An example to review
One reading turns down while the other remains elevated. Review whether this accompanies a brief pause or a broader change in price behavior.
Illustrative reading example, not a recorded trade or performance claim.
What to keep in mind
An extreme reading can persist. A crossover or disagreement does not by itself confirm a reversal.
Use the current AMT study on Sierra Chart. Confirm the symbol, chart type, session settings, and available data before comparing examples. Platform and market-data fees are separate.