
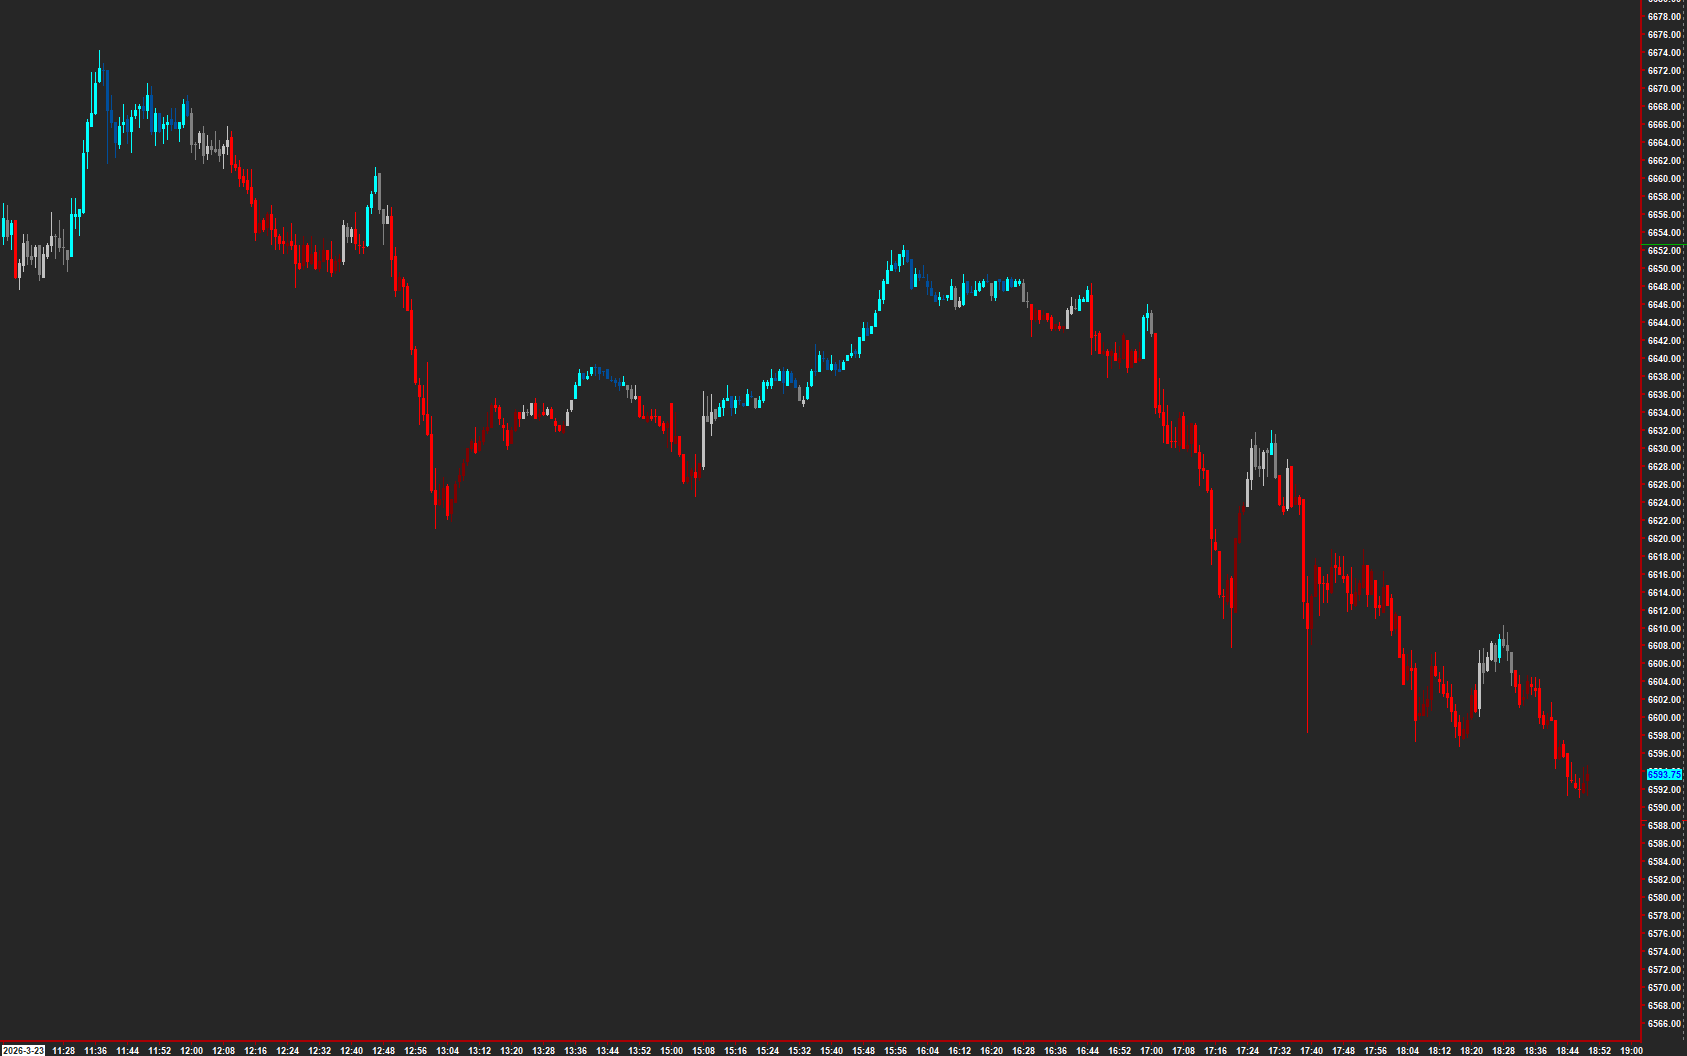
 Open full-size chart ↗
What it shows
34 EMA Wave Bar Coloring changes bar colors to show the displayed wave state alongside each candle direction.
How to read it
- Separate the candle direction from its position relative to the wave.
- Distinguish above-wave, within-wave, and below-wave states using your configured colors.
- Review state changes in context with nearby levels.
Settings that matter
The existing guide lists no configurable inputs. Use the subgraph colors to make the six displayed states readable on your background.
An example to review
A down candle can still be in the above-wave state. That describes a pullback within that state, not automatically a trend reversal.
Illustrative reading example, not a recorded trade or performance claim.
What to keep in mind
The wave follows past prices and can lag. Repeated state changes can occur in sideways conditions.
Use the current AMT study on Sierra Chart. Confirm the symbol, chart type, session settings, and available data before comparing examples. Platform and market-data fees are separate.