
 Open full-size chart ↗
What it shows
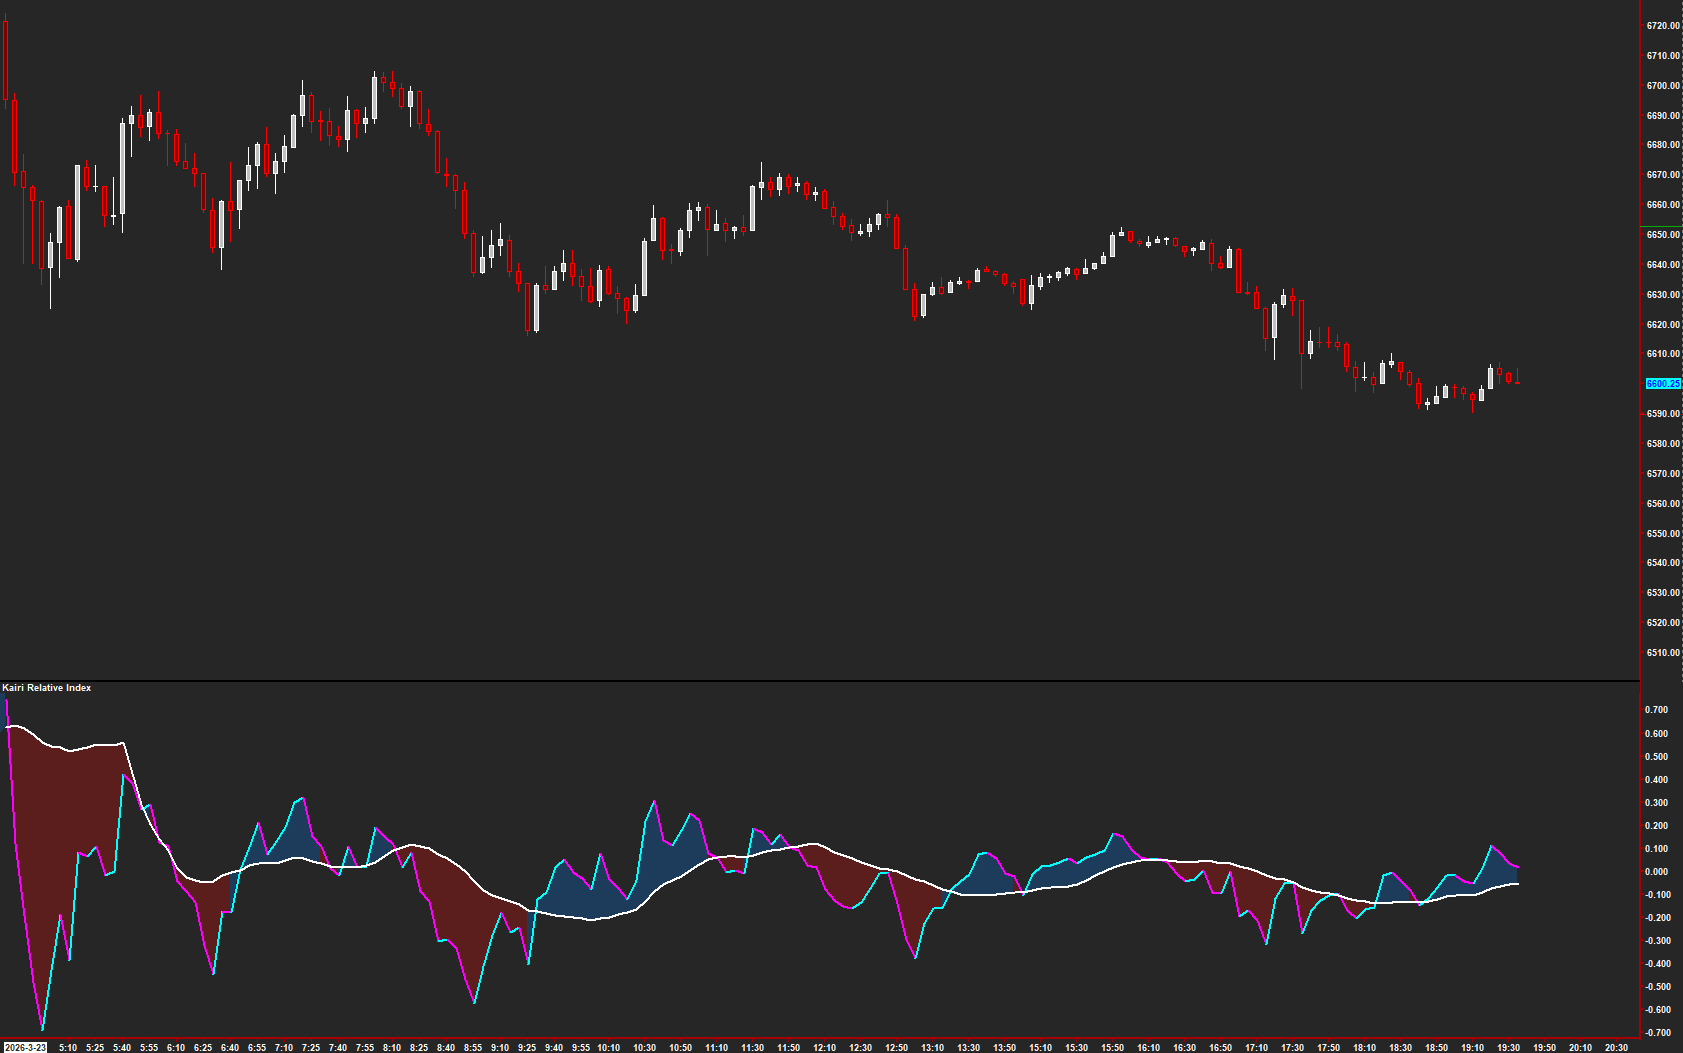
Kairi displays an oscillator around a central reference, helping you review price extension and changes in momentum.
How to read it
- Read which side of the central reference the display occupies.
- Compare its slope and signal line with the price move.
- Study whether an extended reading persists or moves back toward the reference.
Settings that matter
Review Input Data, SMA Period, and Final MA Period. Keep the chart interval fixed when comparing settings.
An example to review
The display remains extended while price continues in the same direction. Review the persistence rather than assuming an immediate return.
Illustrative reading example, not a recorded trade or performance claim.
What to keep in mind
Extension is not a timing signal. A strong trend can remain extended, and a crossover does not guarantee a reversal.
Use the current AMT study on Sierra Chart. Confirm the symbol, chart type, session settings, and available data before comparing examples. Platform and market-data fees are separate.