
 Open full-size chart ↗
What it shows
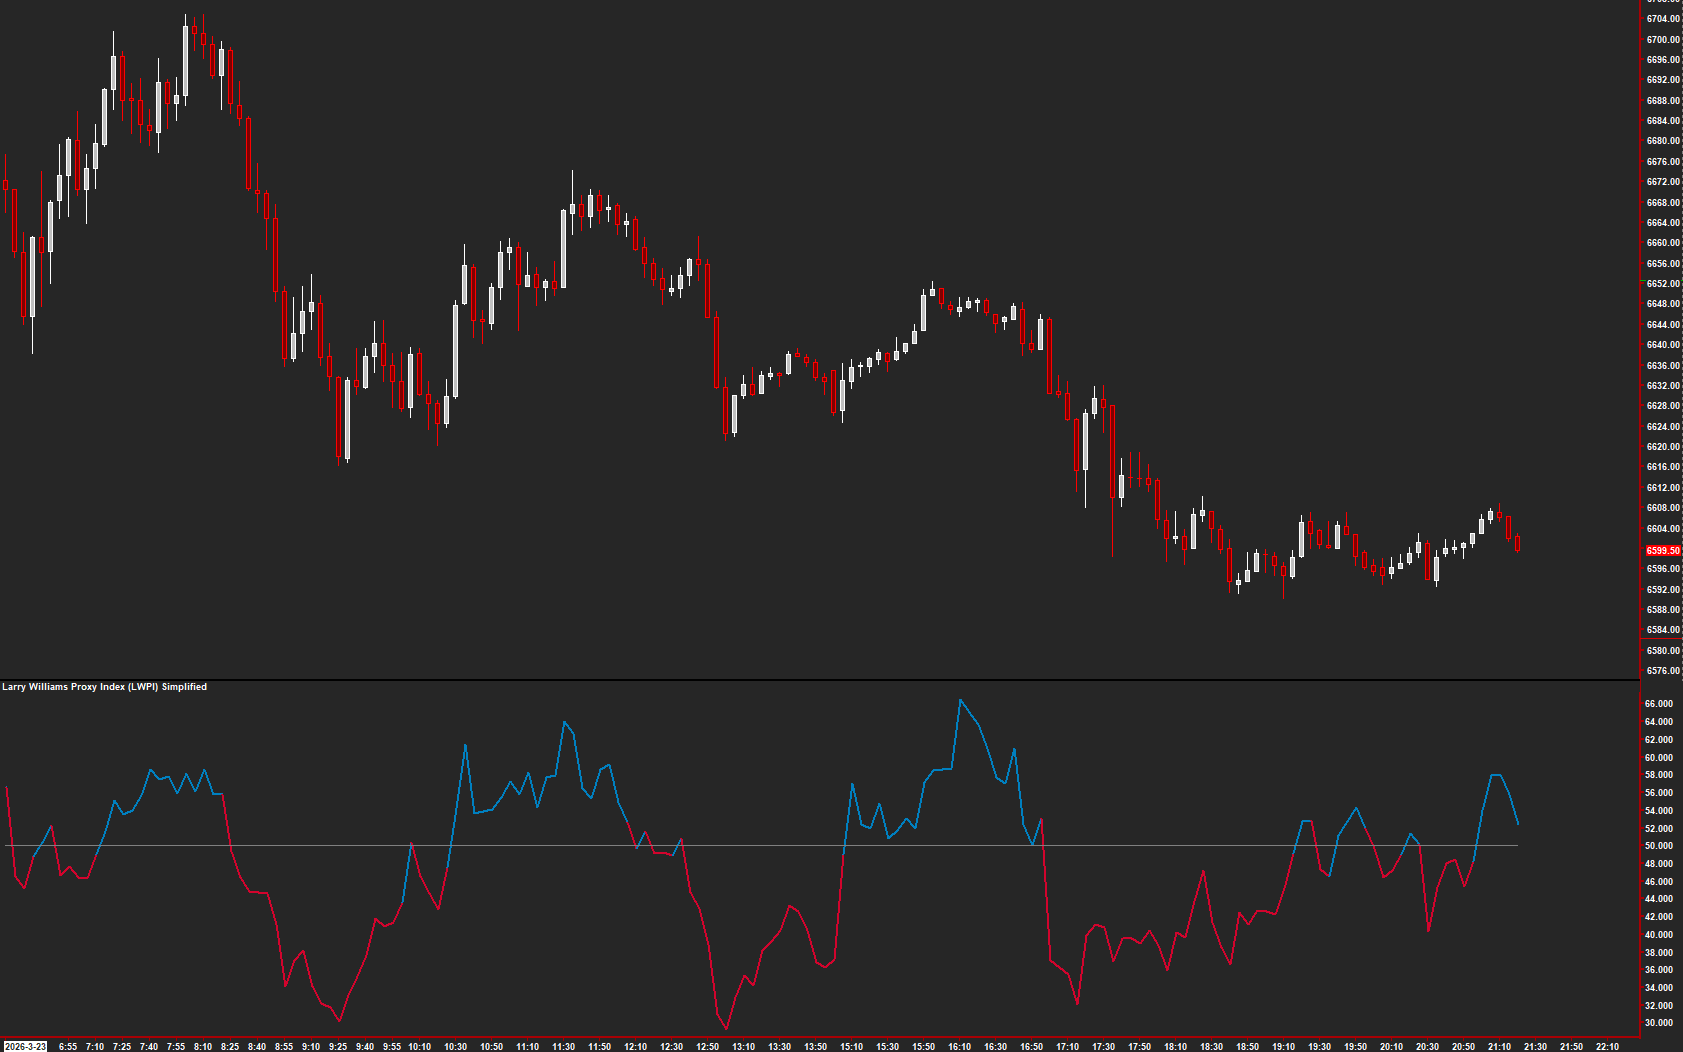
The simplified Larry Williams Proxy Index displays a color-changing momentum line around a central reference.
How to read it
- Identify the current side of the central reference.
- Follow color changes alongside the line direction.
- Compare transitions with the price structure you are already watching.
Settings that matter
The Period control changes the display response. Compare settings using the same market, interval, and date range.
An example to review
The line changes state while price is still inside a range. Review whether price follows through before treating the transition as meaningful context.
Illustrative reading example, not a recorded trade or performance claim.
What to keep in mind
Short-lived crosses are possible. The display does not measure future trade success or guarantee continuation.
Use the current AMT study on Sierra Chart. Confirm the symbol, chart type, session settings, and available data before comparing examples. Platform and market-data fees are separate.