
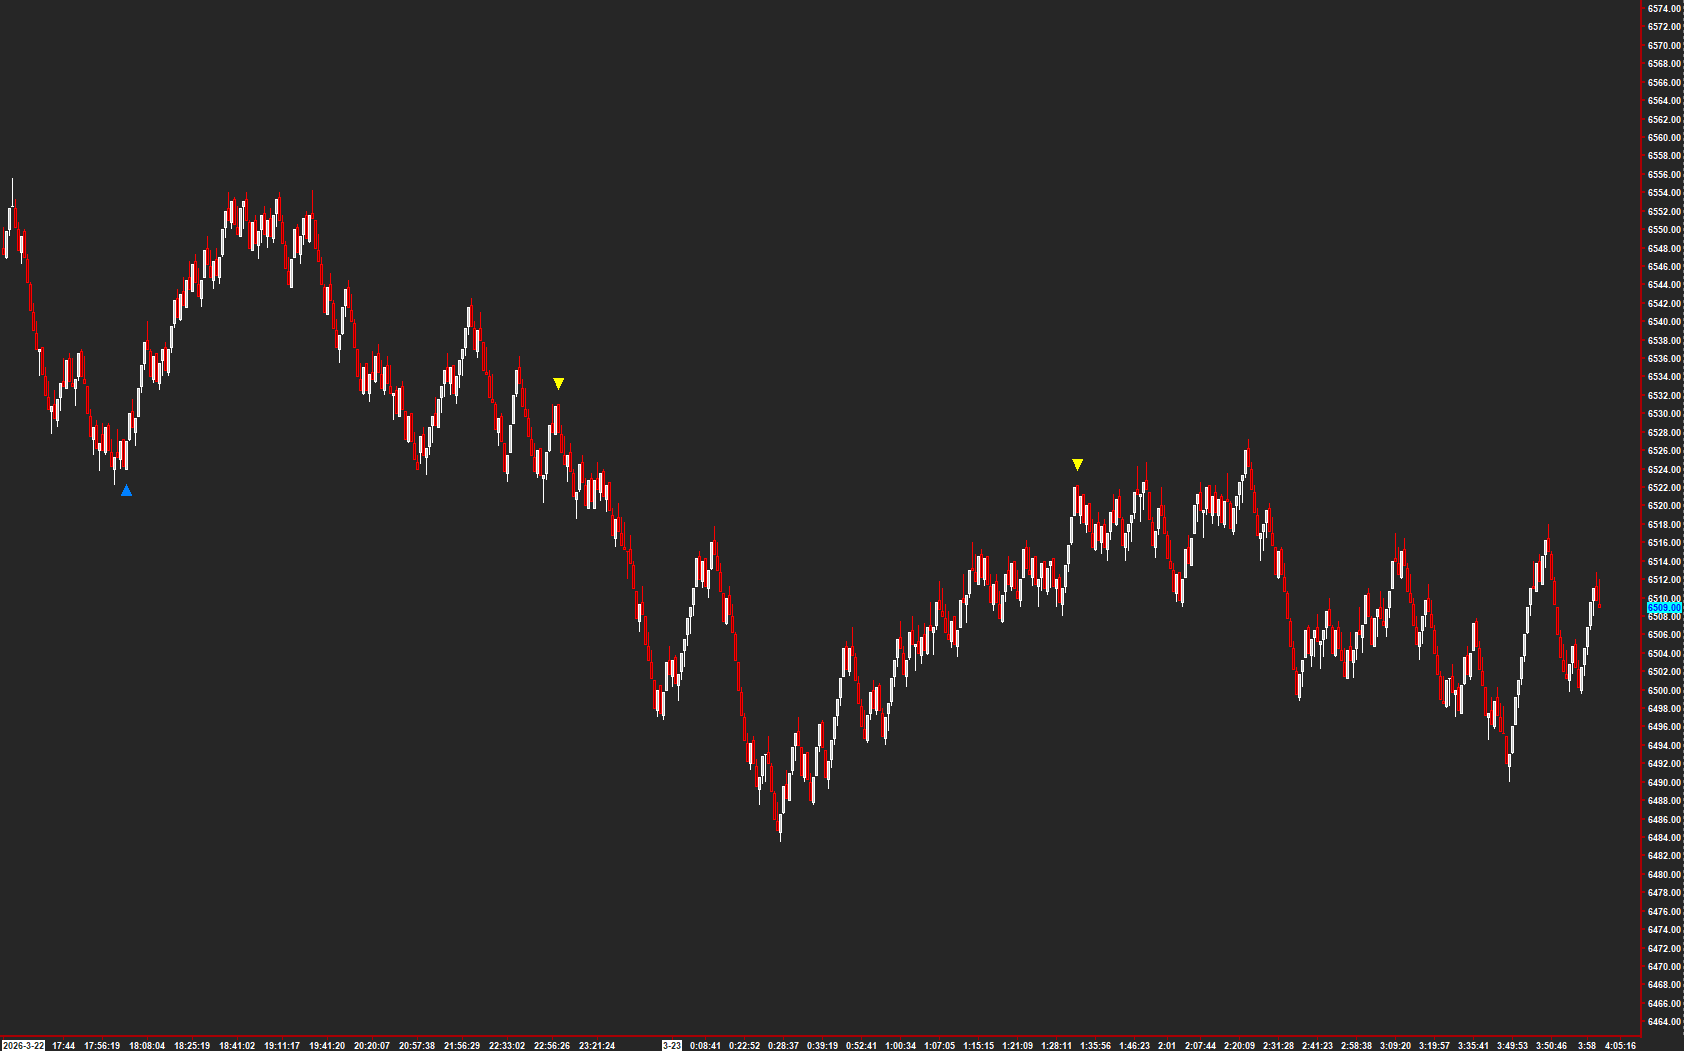
 Open full-size chart ↗
What it shows
Range Spotlight marks qualifying changes in bar-pattern direction directly on the price chart.
How to read it
- Locate the marker and the bars around it.
- Compare the marked pattern with nearby levels and the surrounding price move.
- Review what price did after the pattern, including examples that did not follow through.
Settings that matter
Tick Offset moves the marker for readability. Allow 1 Tick Wick changes which patterns can qualify, so keep that choice consistent in a review.
An example to review
A marker appears near a level you were already watching. Examine the surrounding bars and subsequent response before deciding whether the pattern is useful to your process.
Illustrative reading example, not a recorded trade or performance claim.
What to keep in mind
A marked pattern is not proof of a turning point. Results depend on chart construction and the selected settings.
Use the current AMT study on Sierra Chart. Confirm the symbol, chart type, session settings, and available data before comparing examples. Platform and market-data fees are separate.