
 Open full-size chart ↗
What it shows
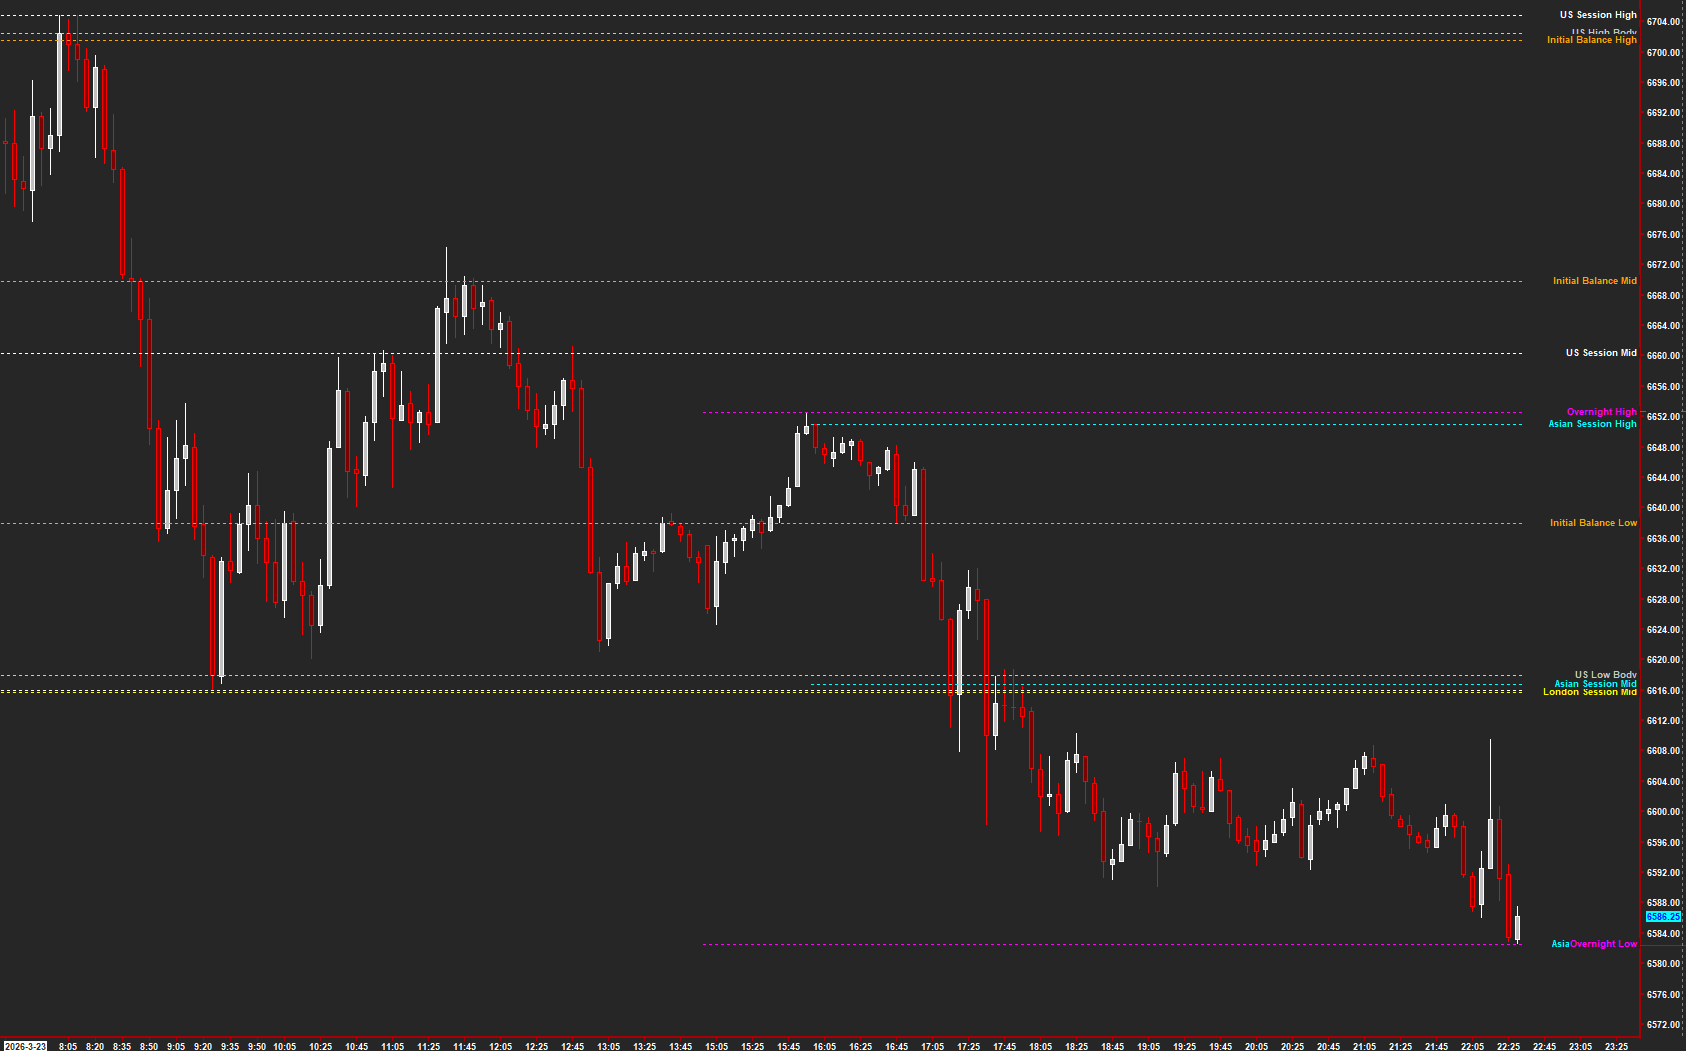
Session High-Low Tracker displays configurable session references, including the US, London, Asian, Overnight, and Initial Balance periods.
How to read it
- Identify which session each line belongs to.
- Distinguish an active session reference from one whose session has ended.
- Compare price with the relevant session range without loading every reference onto one chart.
Settings that matter
Enable only the sessions you use. Verify all start and end times against the chart timezone and the instrument session.
An example to review
Price returns to an overnight reference during the main session. Use the line to locate the test, then observe the response.
Illustrative reading example, not a recorded trade or performance claim.
What to keep in mind
Incorrect session times or incomplete history can change the references. A level does not guarantee a hold or break.
Use the current AMT study on Sierra Chart. Confirm the symbol, chart type, session settings, and available data before comparing examples. Platform and market-data fees are separate.