
 Open full-size chart ↗
What it shows
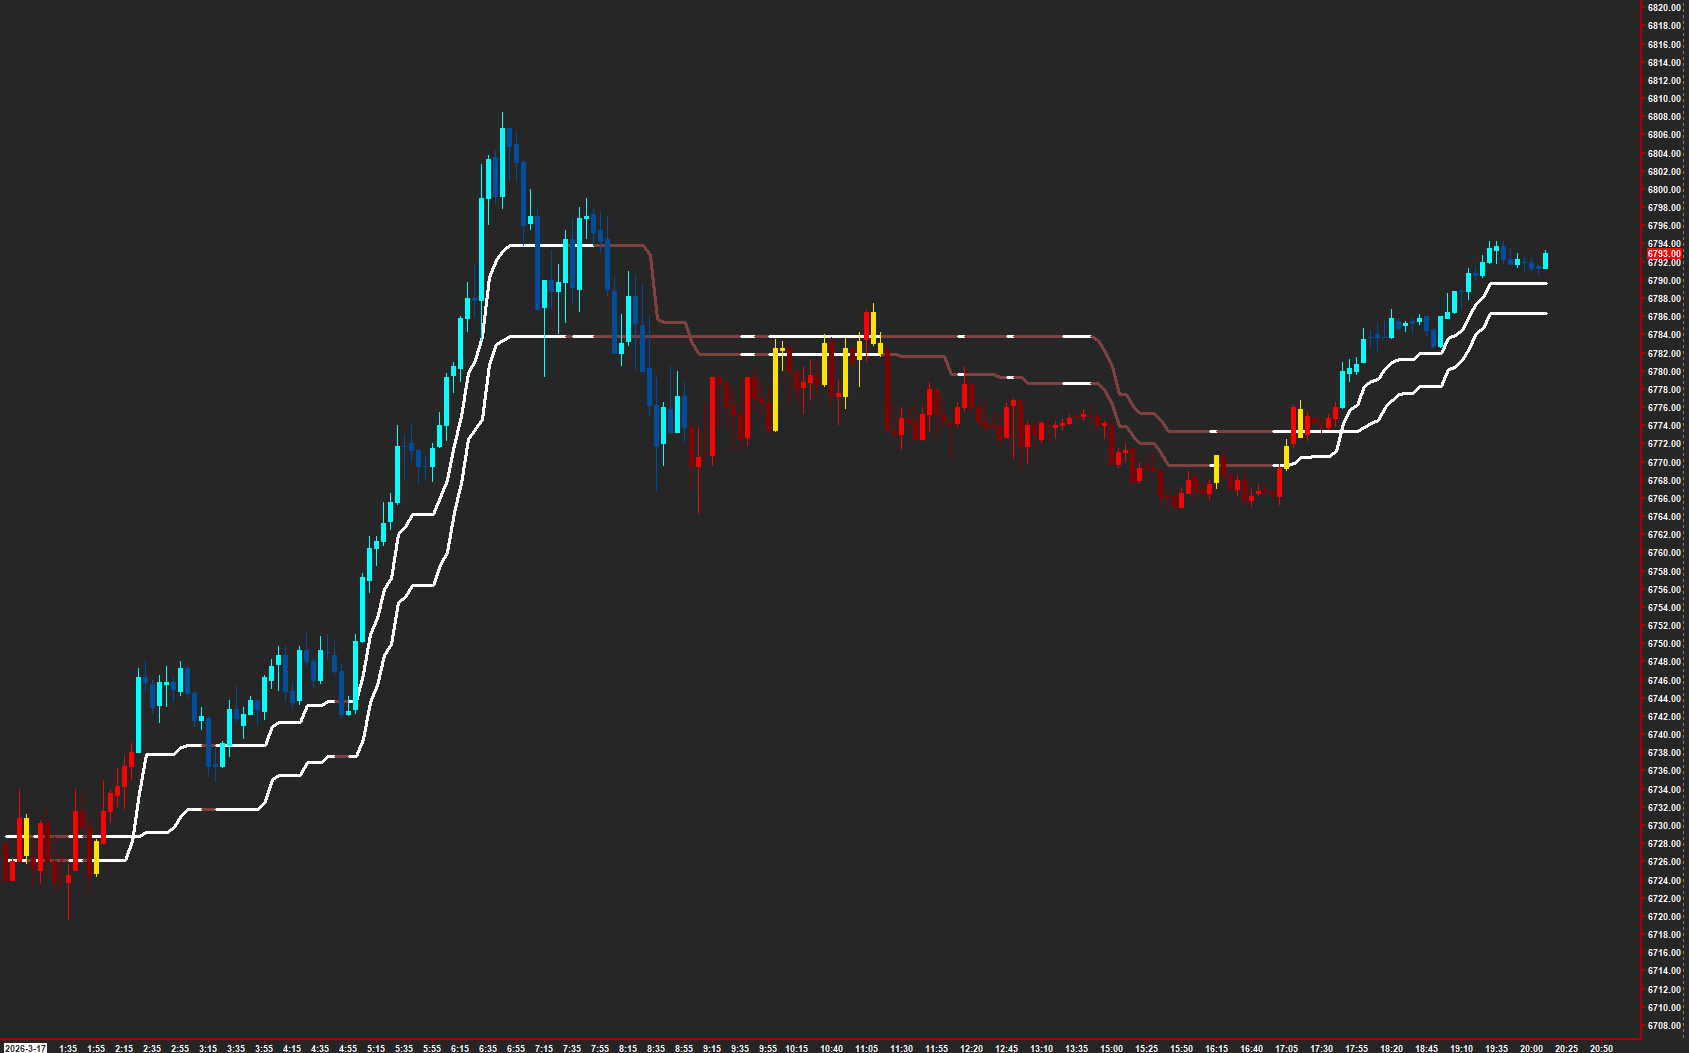
Trend Zero shows Alpha and Beta reference lines with bar coloring that helps you read price around them.
How to read it
- Locate price relative to both reference lines.
- Compare the current color state with the candle direction.
- Pay attention when price moves between the lines rather than remaining on one side.
Settings that matter
Review Cycle Source, Cycle Period, and the available volatility controls. Check line and bar colors against your chart background.
An example to review
A down candle appears while price remains above both lines. Read the pullback and the broader state separately.
Illustrative reading example, not a recorded trade or performance claim.
What to keep in mind
The references adapt to chart history and can lag. A colored state does not establish the strength or profitability of a trade.
Use the current AMT study on Sierra Chart. Confirm the symbol, chart type, session settings, and available data before comparing examples. Platform and market-data fees are separate.