
 Open full-size chart ↗
What it shows
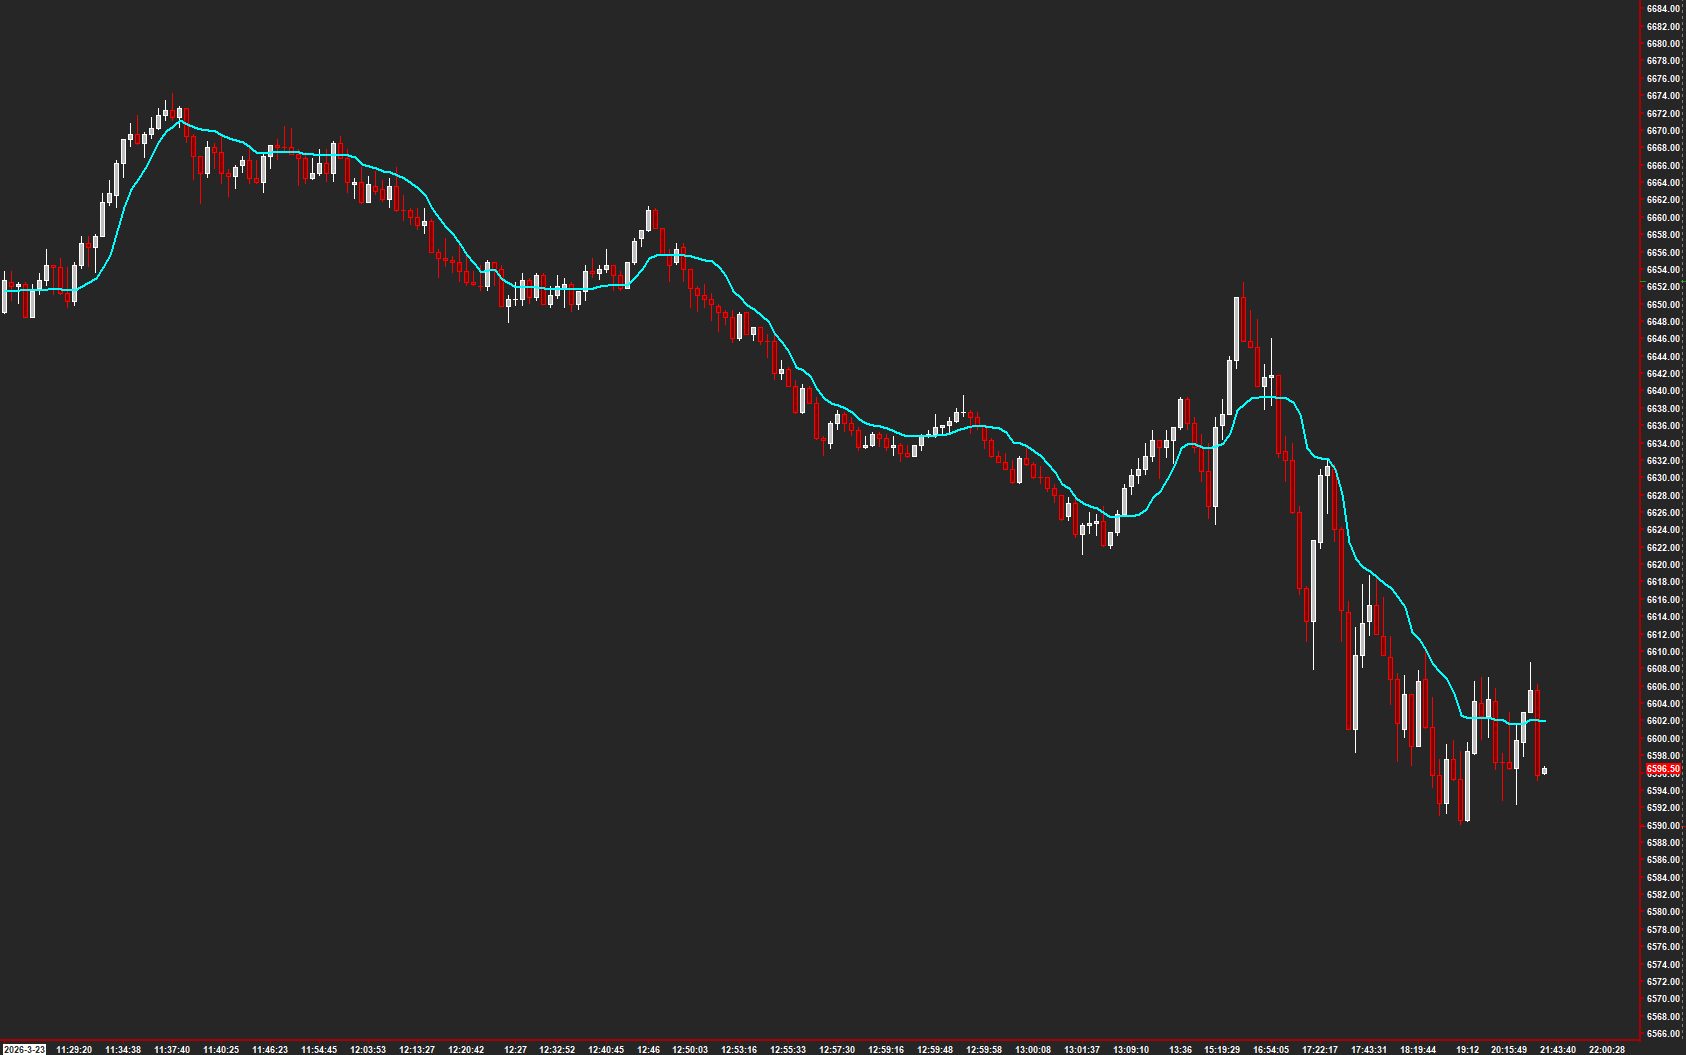
VEMA adds an adaptive reference line to your price chart for reading direction and changes in the current move.
How to read it
- Compare price with the line rather than treating each touch as a trade.
- Notice whether the line is rising, falling, or flattening.
- Review repeated crossings in sideways conditions separately from sustained moves.
Settings that matter
Check Input Data, Input Length, and Volatility Period. Keep the symbol, session, and bar interval consistent while comparing settings.
An example to review
Price repeatedly crosses a flattening VEMA. That is different context from a sustained move holding on one side of a rising line.
Illustrative reading example, not a recorded trade or performance claim.
What to keep in mind
The line uses past chart data and can lag a turn. A touch or crossover does not establish support, resistance, or a future outcome.
Use the current AMT study on Sierra Chart. Confirm the symbol, chart type, session settings, and available data before comparing examples. Platform and market-data fees are separate.