
TRADINGVIEW · Put the opening gap in context
AMT Half Gap
for TradingView.
Plot the midpoint between the prior regular-session close and current open, with historical reference rates by gap size and direction.
See the published script for current access information. Platform subscriptions and data requirements are separate.
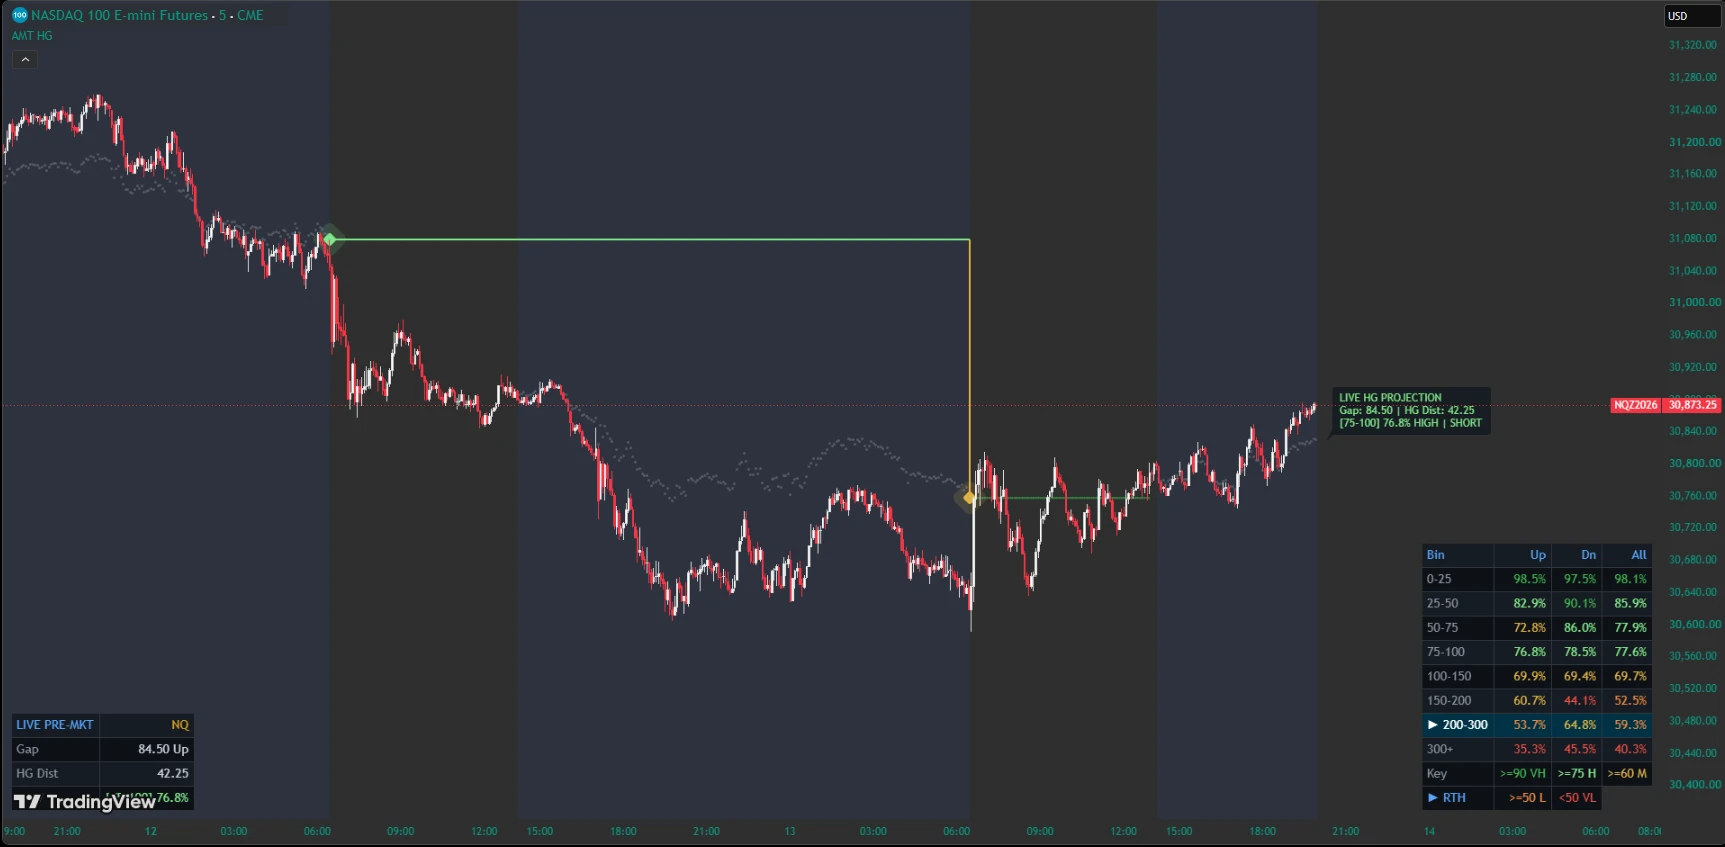
A midpoint, not an entry signal
Half Gap = (prior RTH close + current RTH open) / 2. It lies below the open after a gap up and above it after a gap down. The close is the last observed regular-session chart-bar close, not official exchange settlement. LONG and SHORT labels describe the direction toward the midpoint.
What counts as filled
FILLED means price reached the tolerance boundary toward Half Gap; an exact midpoint touch is not required. Opening-bar fills are excluded. ES uses 1.25 points tolerance and 1.50 points minimum midpoint distance; NQ uses 5 and 4 points; RTY uses 1 and 0.50 points; CL uses $0.05 and $0.03.
Configure the session
ES, NQ, and RTY use 9:30 AM–4 PM New York time; CL uses 9 AM–2:30 PM on weekdays. Automatic detection includes micro contracts, with a manual override available. Use standard intraday candles and enough prior-session history. A one-minute chart gives finer tracking; larger intervals can change observed opening and closing references or fill timing.
Use historical context carefully
Tables group fixed historical rates by full opening gap width and direction, with a combined-rate option. Outside-session projections treat current price as a provisional next open. Opening-bar alert conditions use your selected reference-rate threshold. A historical destination rate is not a trade win rate or a forecast of the next session.