
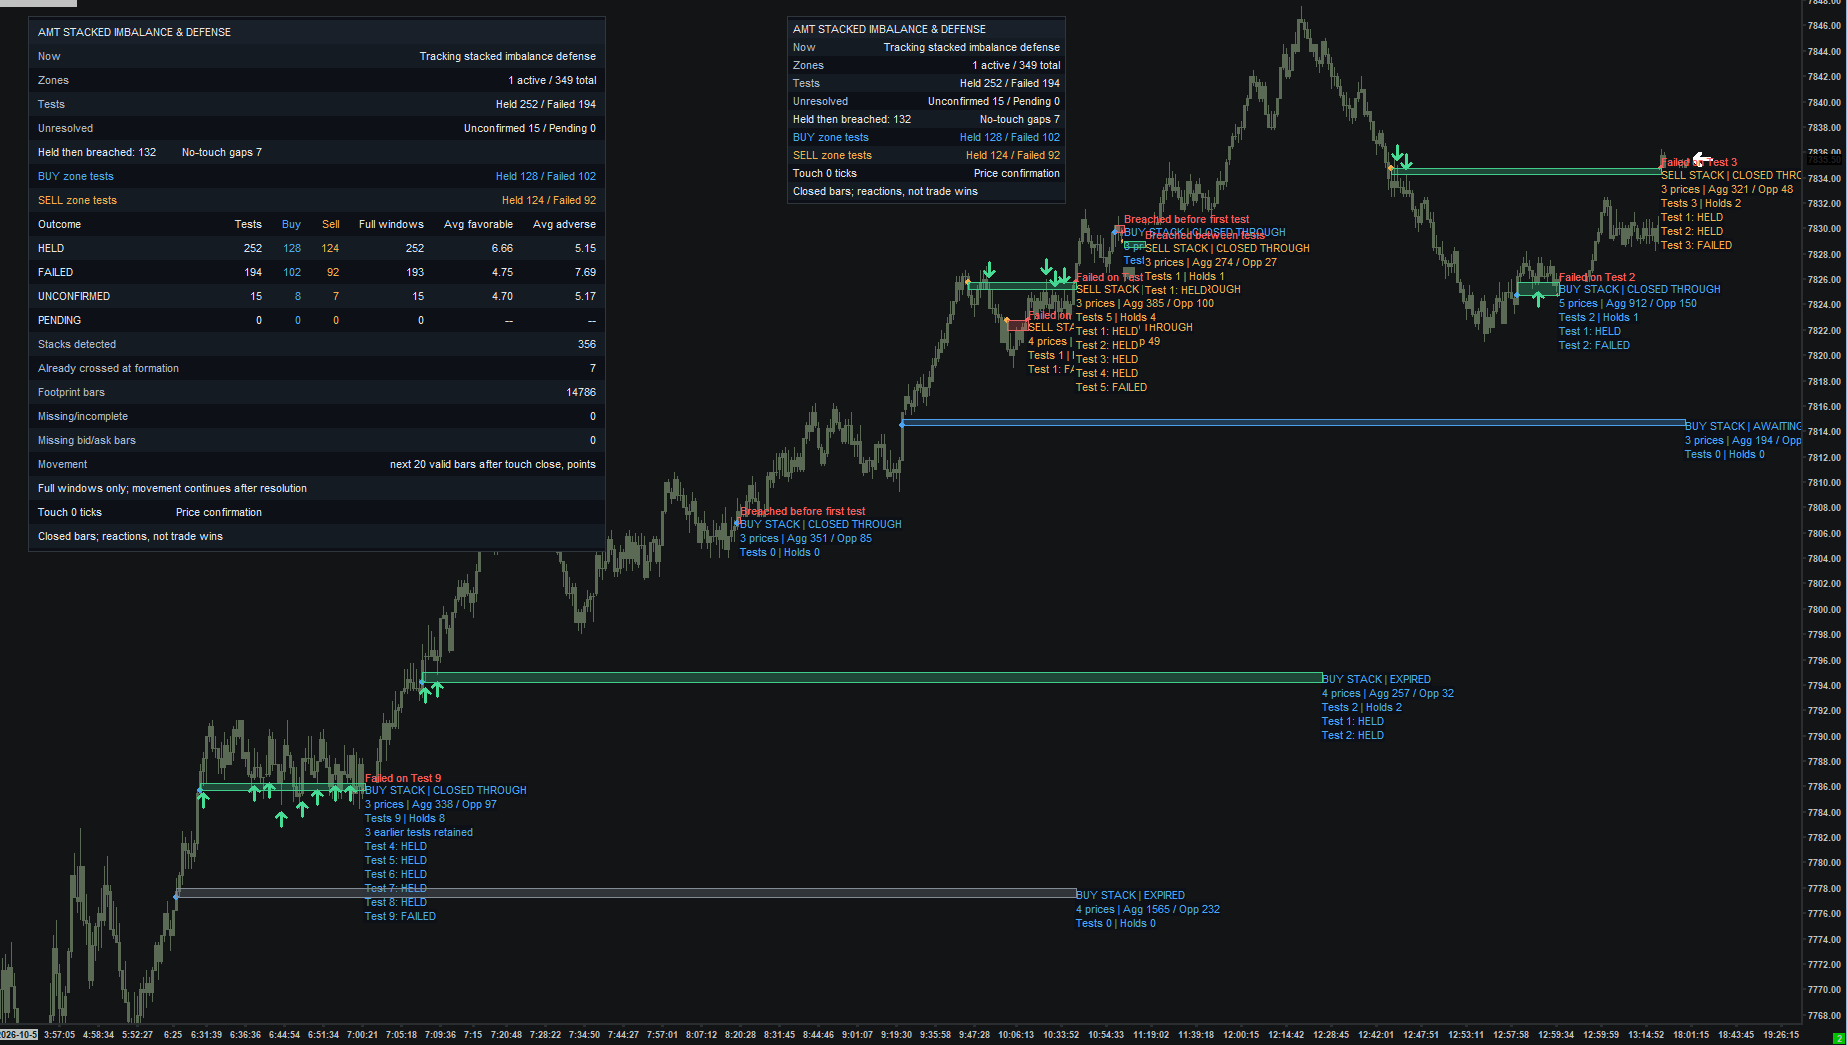
 Open full-size chart ↗
Review the history. Keep your chart clean.
The detailed tables and historical labels help you verify, study, and learn how price reacted. Compact and detailed views are shown together here for comparison. Use the study display settings to show or hide supported after-reaction details; once familiar with the levels, keep your live trading chart as clean as you prefer. Historical observations are not trade win rates.
What it shows
A stack needs consecutive footprint prices that satisfy imbalance and volume requirements. The resulting zone is frozen, then tracked through departure, retests, holds, and breaches.
How to read it
- A new stack marks concentrated execution, not an already-defended zone.
- After departure, wait for an actual return and qualifying reaction close.
- Read holds and breaches against the original stack direction; a zone can hold first and fail later.
Settings that matter
Defaults require three consecutive prices and a 300% ratio (3:1). Comparison defaults to diagonal; same-price is available. Zero opposing volume is excluded by default. Volume floors and retest thresholds are adjustable.
Example sequence
Three buy imbalances form a zone. Price leaves upward and returns. A qualifying close above its near edge confirms defense; a close beyond the far edge can record failure.
What to keep in mind
Footprints show executed trades, not a resting-order wall. Missing prices and comparison mode affect qualification. Historical volume-at-price data is required.