
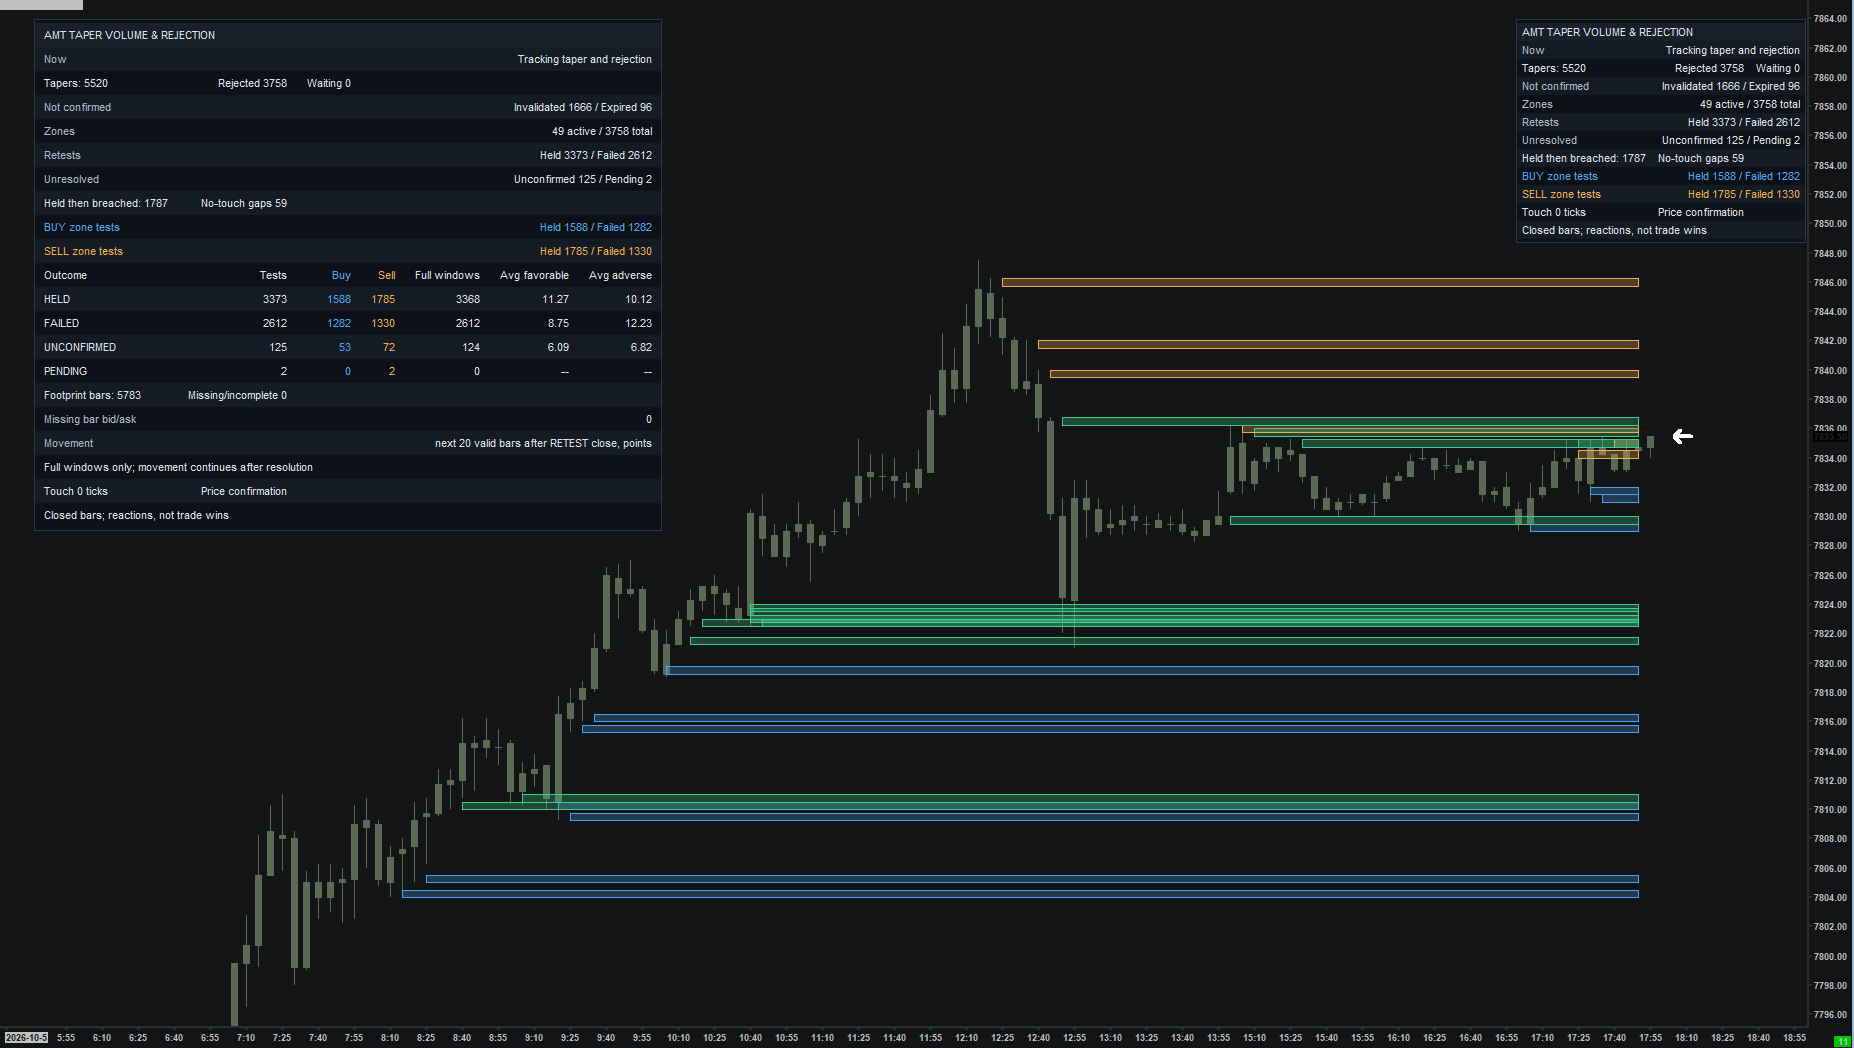
 Open full-size chart ↗
Review the history. Keep your chart clean.
The detailed tables and historical labels help you verify, study, and learn how price reacted. Compact and detailed views are shown together here for comparison. Use the study display settings to show or hide supported after-reaction details; once familiar with the levels, keep your live trading chart as clean as you prefer. Historical observations are not trade win rates.
Beyond the free Toolkit
What this adds to Taper Volume
In the free Toolkit
Highlights qualifying declines in footprint volume toward bar extremes.
In paid Order Flow
Separates taper candidates from later rejection confirmation, creates zones, and tracks subsequent tests, holds, breaches, and historical observations.
Follow the sequence from a footprint pattern to confirmed rejection and a later test.
Explore the free Taper Volume study →What it shows
The study examines consecutive footprint prices for a qualifying volume drop toward the tip. Candidate dots, later rejection confirmations, and retest hold/breach markers describe separate stages.
How to read it
- A taper candidate passed the footprint-shape filters; it is not yet confirmed rejection.
- Look for the later close beyond the configured inner-edge distance within the confirmation window.
- After a zone forms, follow departure and the actual retest before interpreting a hold.
Settings that matter
Taper Levels, minimum interior volume, and Interior-to-Tip Volume Drop define the pattern. Volume basis defaults to directional bid/ask. Requiring a finished extreme is optional and off by default.
Example sequence
Directional volume fades toward a high. A later close away confirms rejection. A subsequent revisit tests the resulting sell-side zone.
What to keep in mind
A single low-volume extreme is not sufficient. Requires usable historical footprint data. Pattern formation, rejection, and retest happen at different times.