
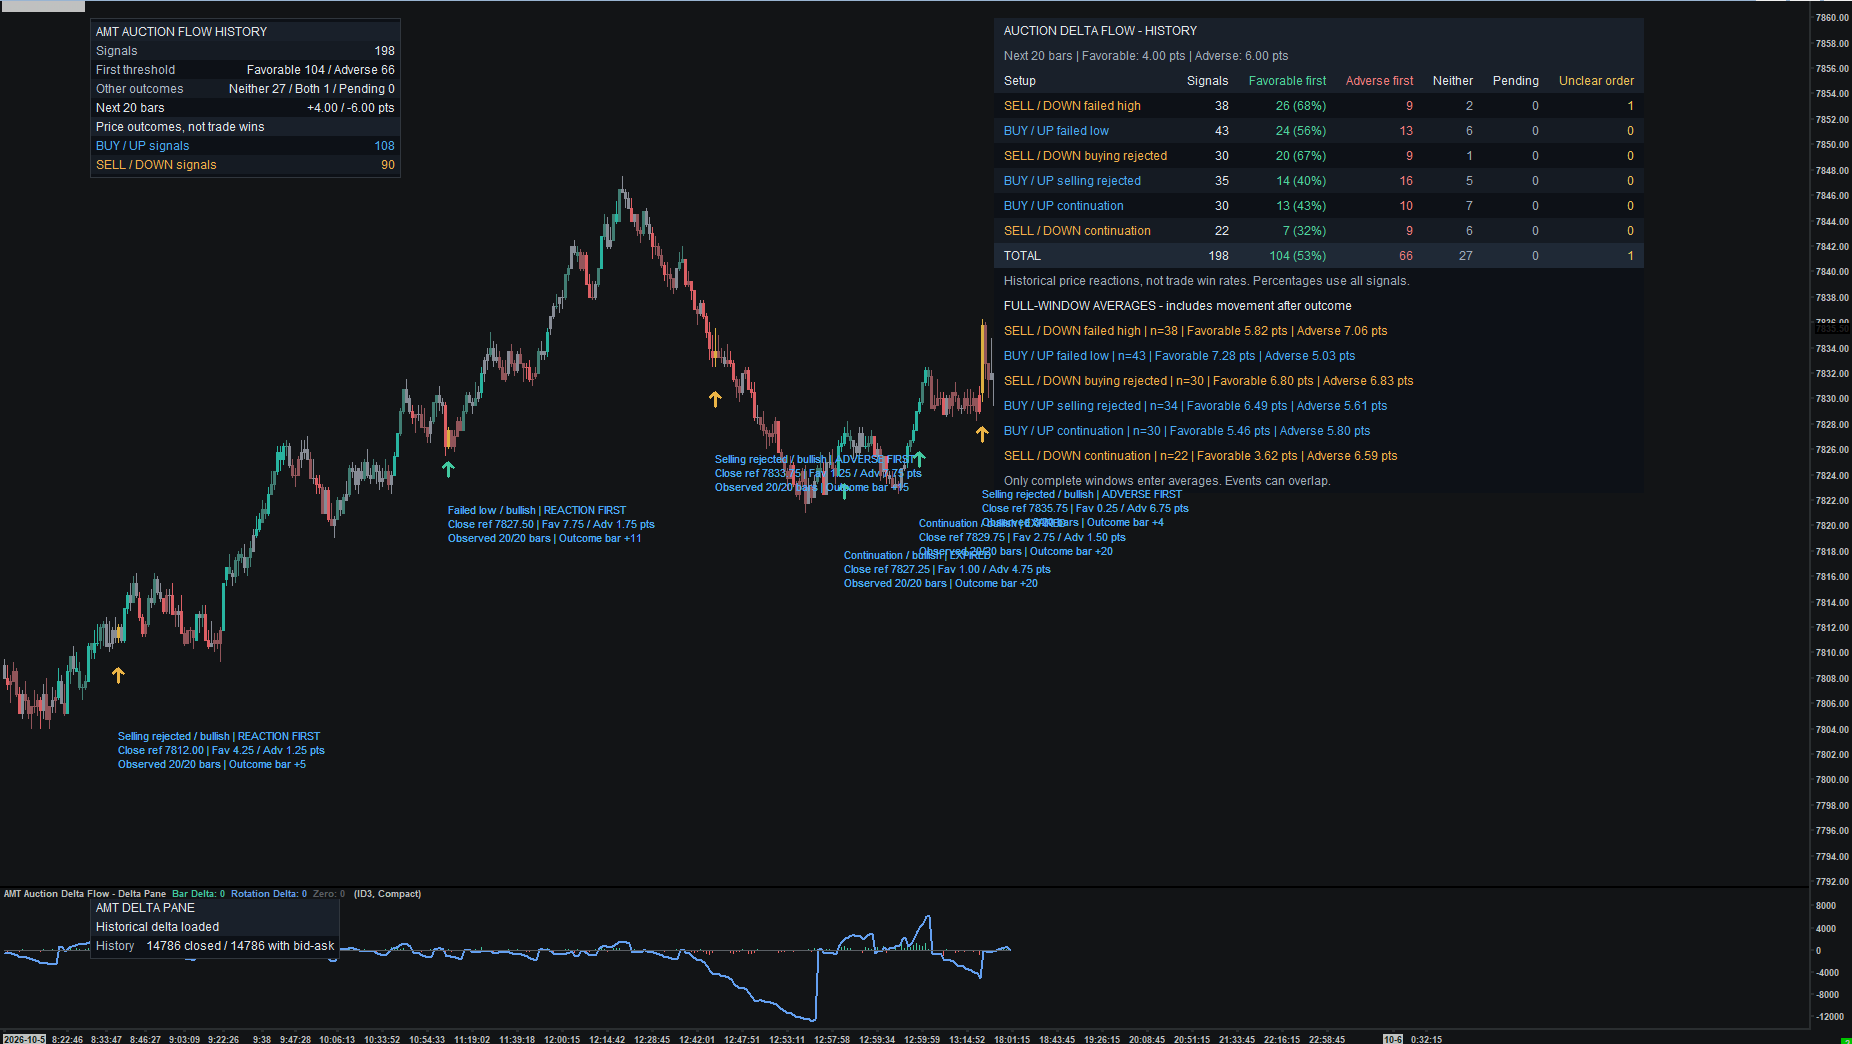
 Open full-size chart ↗
Review the history. Keep your chart clean.
The detailed tables and historical labels help you verify, study, and learn how price reacted. Compact and detailed views are shown together here for comparison. Use the study display settings to show or hide supported after-reaction details; once familiar with the levels, keep your live trading chart as clean as you prefer. Historical observations are not trade win rates.
What it shows
The histogram shows completed-bar ask-minus-bid delta from the chart. The rotation-delta line comes from the main Auction Delta Flow study. A connection status message helps identify missing bid/ask history or an incorrect source.
How to read it
- Add the main Auction Delta Flow study and select it as the companion's source.
- Align the pane with price bars and compare participation with price movement.
- Use the main study's event markers to identify what confirmed; a difference between delta and price is not automatically a reversal.
Settings that matter
In Inputs, select the main Auction Delta Flow Study ID on the same chart, rather than changing Based On. The main study determines rotation analysis. If arrays are unavailable, place the main study above the pane and recalculate.
Example sequence
An upward rotation continues while its delta evidence weakens. The pane makes the contrast visible next to the main study's event markers.
What to keep in mind
Bar delta can appear even when the rotation source is not connected. Check the connection status rather than treating a missing rotation line as zero participation.