
 Open full-size chart ↗
Review the history. Keep your chart clean.
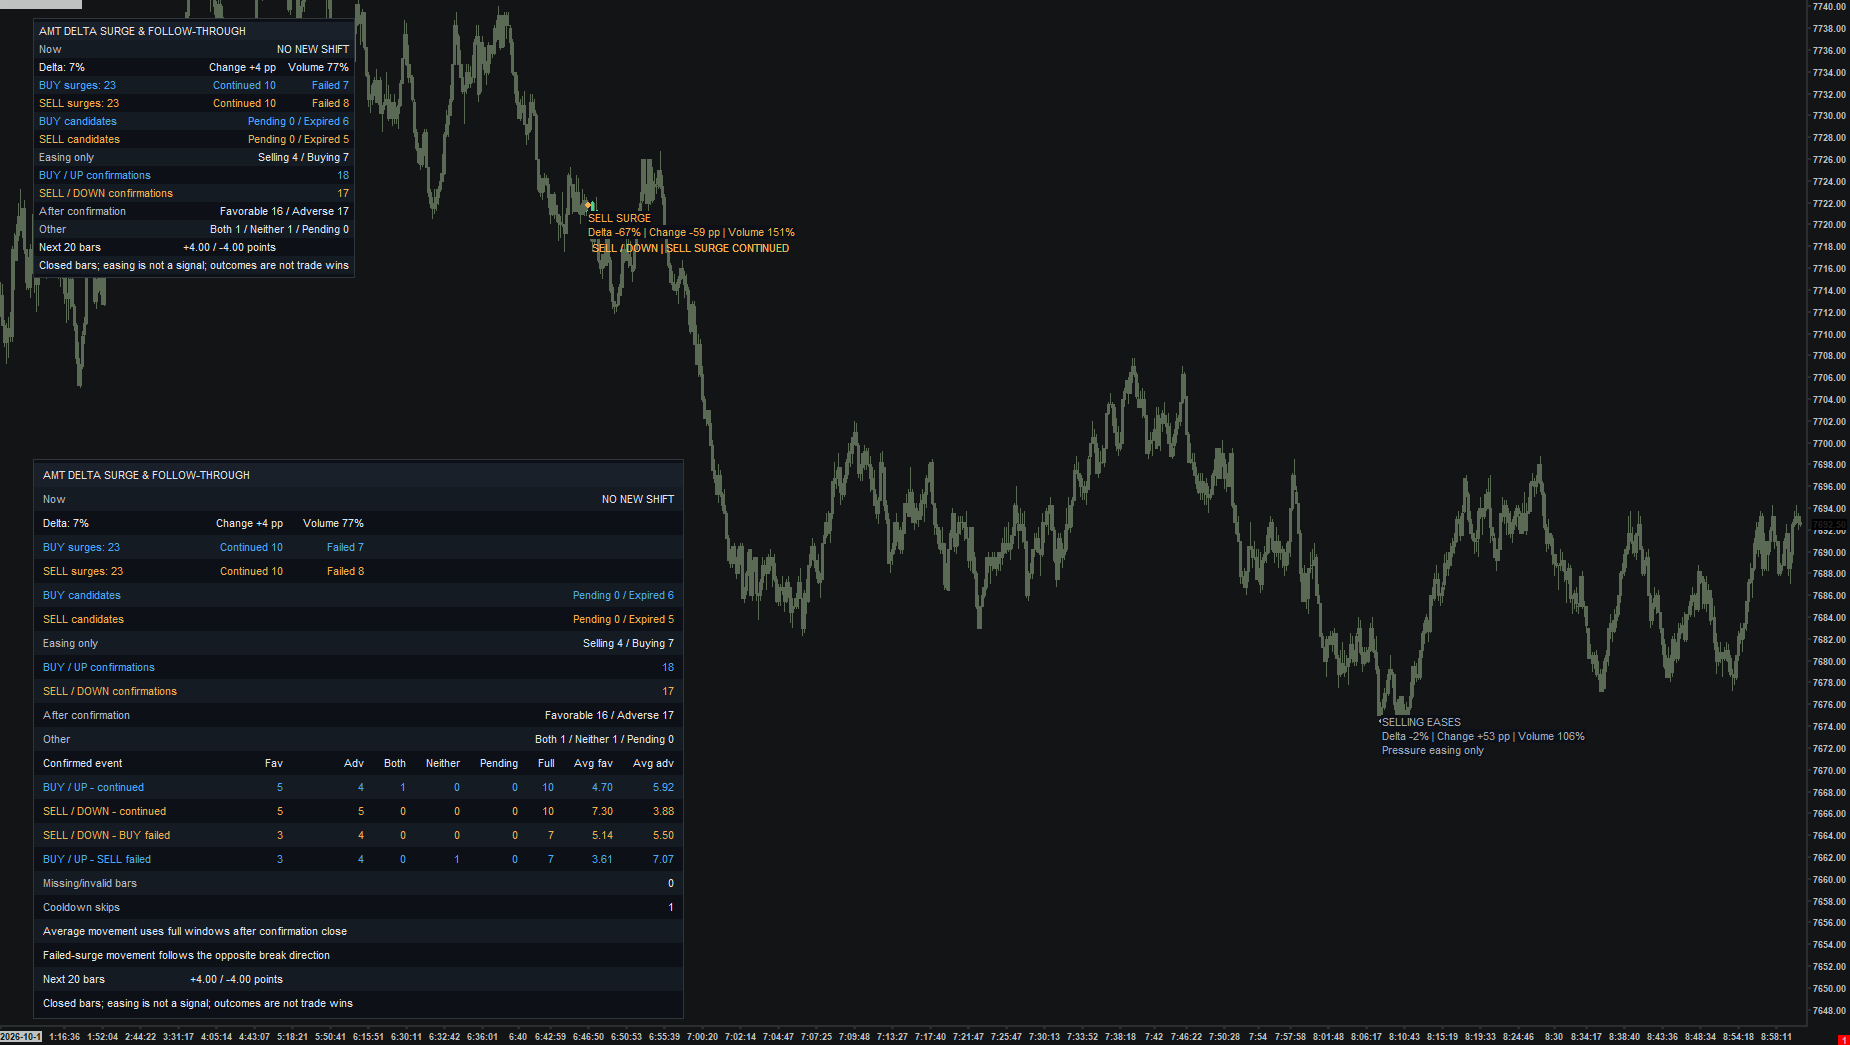
The detailed tables and historical labels help you verify, study, and learn how price reacted. Compact and detailed views are shown together here for comparison. Use the study display settings to show or hide supported after-reaction details; once familiar with the levels, keep your live trading chart as clean as you prefer. Historical observations are not trade win rates.
Beyond the free Toolkit
What this adds to Delta Surge
In the free Toolkit
Flags changes in delta share using change, current-delta, and volume thresholds.
In paid Order Flow
Separates directional surges from easing pressure, adds a prior-volume baseline, and tracks later continuation, failure, expiry, and post-confirmation movement.
Distinguish an initial shift from a surge that received a later price confirmation.
Explore the free Delta Surge study →What it shows
The study compares delta share with the previous bar and volume with a prior baseline. It separates buy surges, sell surges, selling easing, and buying easing. Surges then await later-close continuation, failure, or expiry.
How to read it
- Read the candidate label first. Selling easing is not automatically a buy surge.
- A buy surge can continue up or fail down; a sell surge can continue down or fail up.
- Use the explicit BUY/UP or SELL/DOWN confirmation label. Keep pending and expired candidates separate.
Settings that matter
Delta-share change, minimum directional share, volume, and relative volume filter candidates. Confirmation window, break buffer, and cooldown govern follow-through.
Example sequence
Delta shifts strongly toward buying on qualifying volume. A buy candidate appears. A later boundary break confirms continuation or failure; otherwise the candidate expires.
What to keep in mind
Easing alone is not a signal. Requires historical bid/ask volume and baseline warmup. The summary's favorable/adverse counts describe movement, not trade wins and losses.