
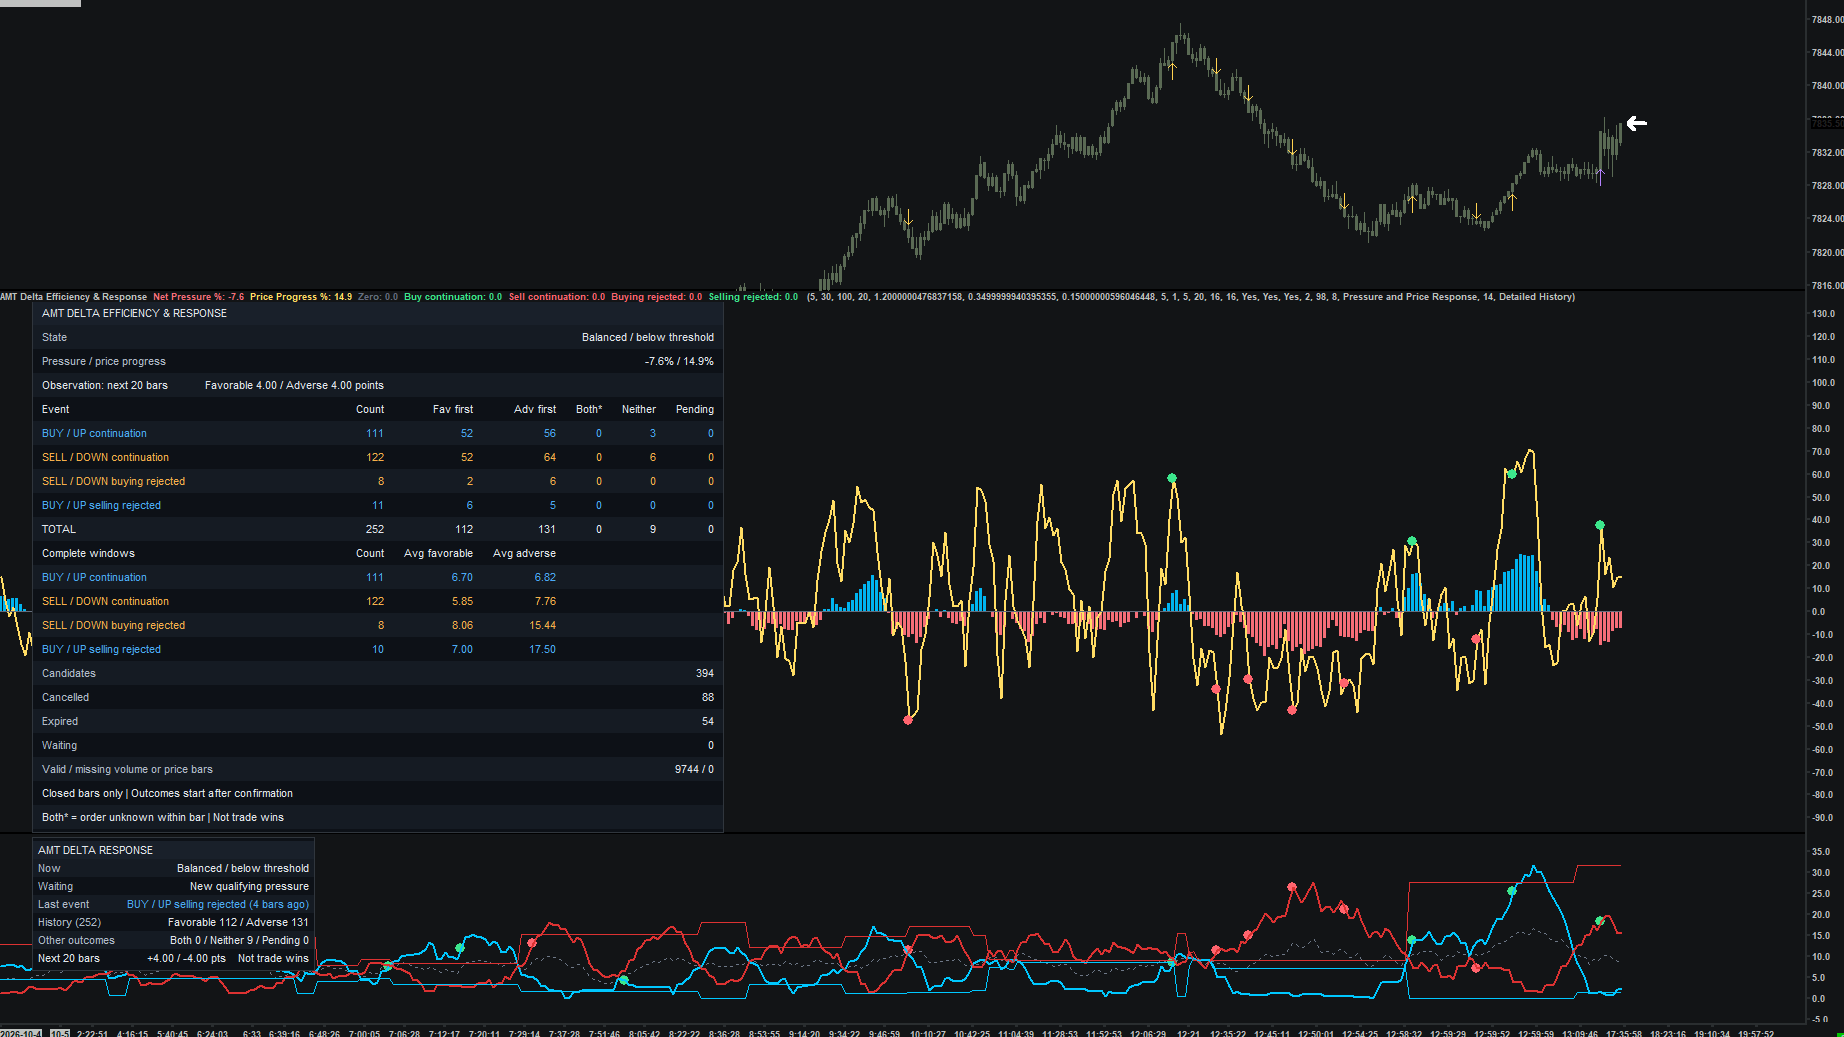
 Open full-size chart ↗
Review the history. Keep your chart clean.
The detailed tables and historical labels help you verify, study, and learn how price reacted. Compact and detailed views are shown together here for comparison. Use the study display settings to show or hide supported after-reaction details; once familiar with the levels, keep your live trading chart as clean as you prefer. Historical observations are not trade win rates.
Beyond the free Toolkit
What this adds to Delta Efficiency
In the free Toolkit
Displays smoothed bid/offer efficiency, a midpoint, and references from the previous efficiency run.
In paid Order Flow
Retains an efficiency-line view and adds pressure/price-response analysis, candidate filters, later-close confirmation, and historical movement outcomes.
Compare visible pressure with confirmed price response and review what followed.
Explore the free Delta Efficiency study →What it shows
The default pane displays offer and bid efficiency lines, midpoint, and previous-run references. An alternative view shows pressure and price response. The event analysis evaluates delta effort, progress or weak response, and later-close confirmations.
How to read it
- Compare the dominant volume side with whether price progresses in that direction.
- Strong delta with weak price response is a candidate condition; wait for the required later confirmation.
- Separate current status, confirmed events, and subsequent movement in the summary.
Settings that matter
Pane Display selects Original Efficiency Lines or Pressure and Price Response. The analysis window, prior delta baseline, minimum effort, and later-close confirmation window control detection.
Example sequence
Offer-side activity is strong but price makes little upward progress. The study can identify weak response, then wait for a later close to resolve the candidate.
What to keep in mind
Requires historical bid/ask volume. Completed-bar events need no external level. Favorable/adverse movement after confirmation is not a trading return.