
 Open full-size chart ↗
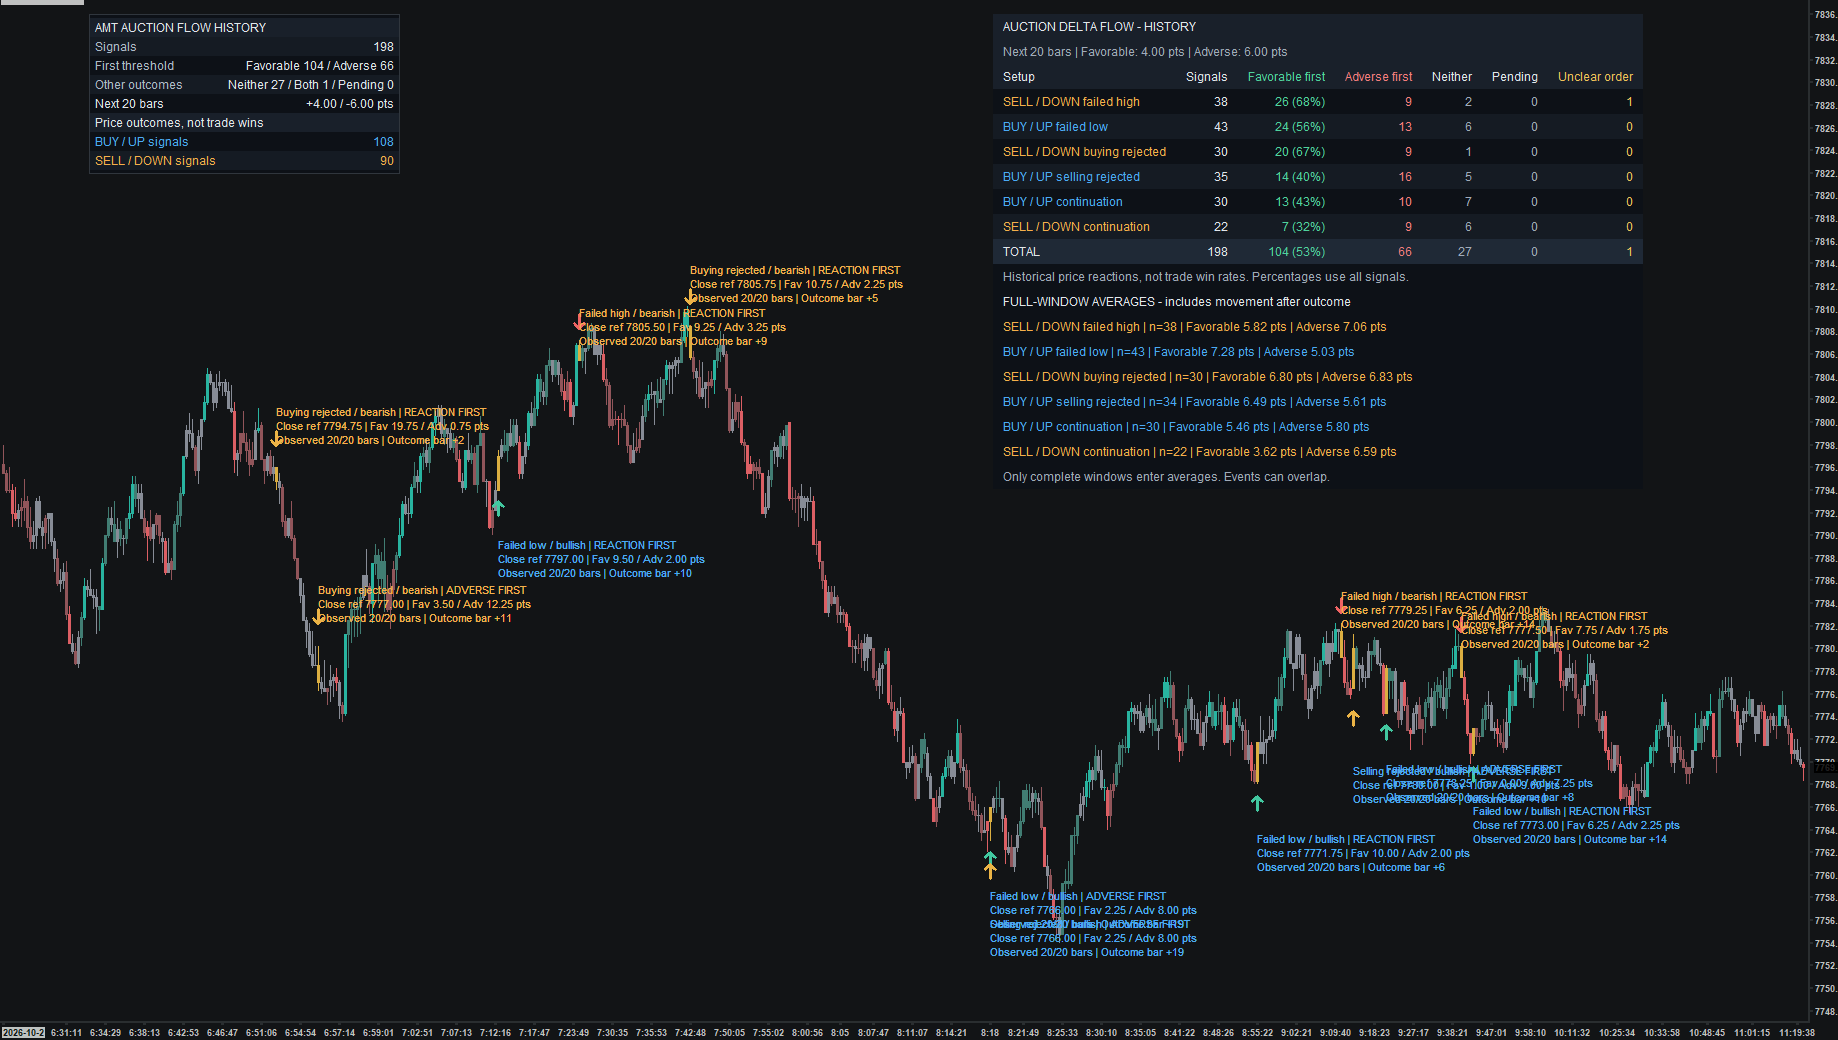
Review the history. Keep your chart clean.
The detailed tables and historical labels help you verify, study, and learn how price reacted. Compact and detailed views are shown together here for comparison. Use the study display settings to show or hide supported after-reaction details; once familiar with the levels, keep your live trading chart as clean as you prefer. Historical observations are not trade win rates.
Beyond the free Toolkit
What this adds to Auction Flow
In the free Toolkit
Colors candles to highlight order-flow states such as dominance, exhaustion, and absorption.
In paid Order Flow
Adds rotation-level delta context, confirmed failed-auction/rejection/continuation events, optional level filtering, and historical outcome observations.
Connect individual bar conditions to a broader rotation and a confirmed event sequence.
Explore the free Auction Flow study →What it shows
The study combines bar delta, rotation delta, relative delta effort, and price progress. It marks confirmed failed auctions, rejected buying or selling effort, and bullish or bearish continuation.
How to read it
- Compare delta with price progress. Heavy buying that cannot move price higher differs from buying that carries price upward.
- Read the event label and arrow direction. A failed up auction is bearish; a failed down auction is bullish.
- Keep rejected effort separate from confirmed continuation. The markers describe different price sequences.
Settings that matter
Rotation reversal mode and distance, minimum delta share, relative delta threshold, and confirmation window control sensitivity. The optional referenced-level filter is off by default.
Example sequence
Price pushes beyond a confirmed high but cannot sustain the move. If the later confirmation conditions are met, a failed up auction is marked. It was not known at the original high.
What to keep in mind
Requires historical bid/ask volume and baseline warmup. Events use completed bars. Historical movement outcomes are not filled trades or a strategy win rate.