
 Open full-size chart ↗
Review the history. Keep your chart clean.
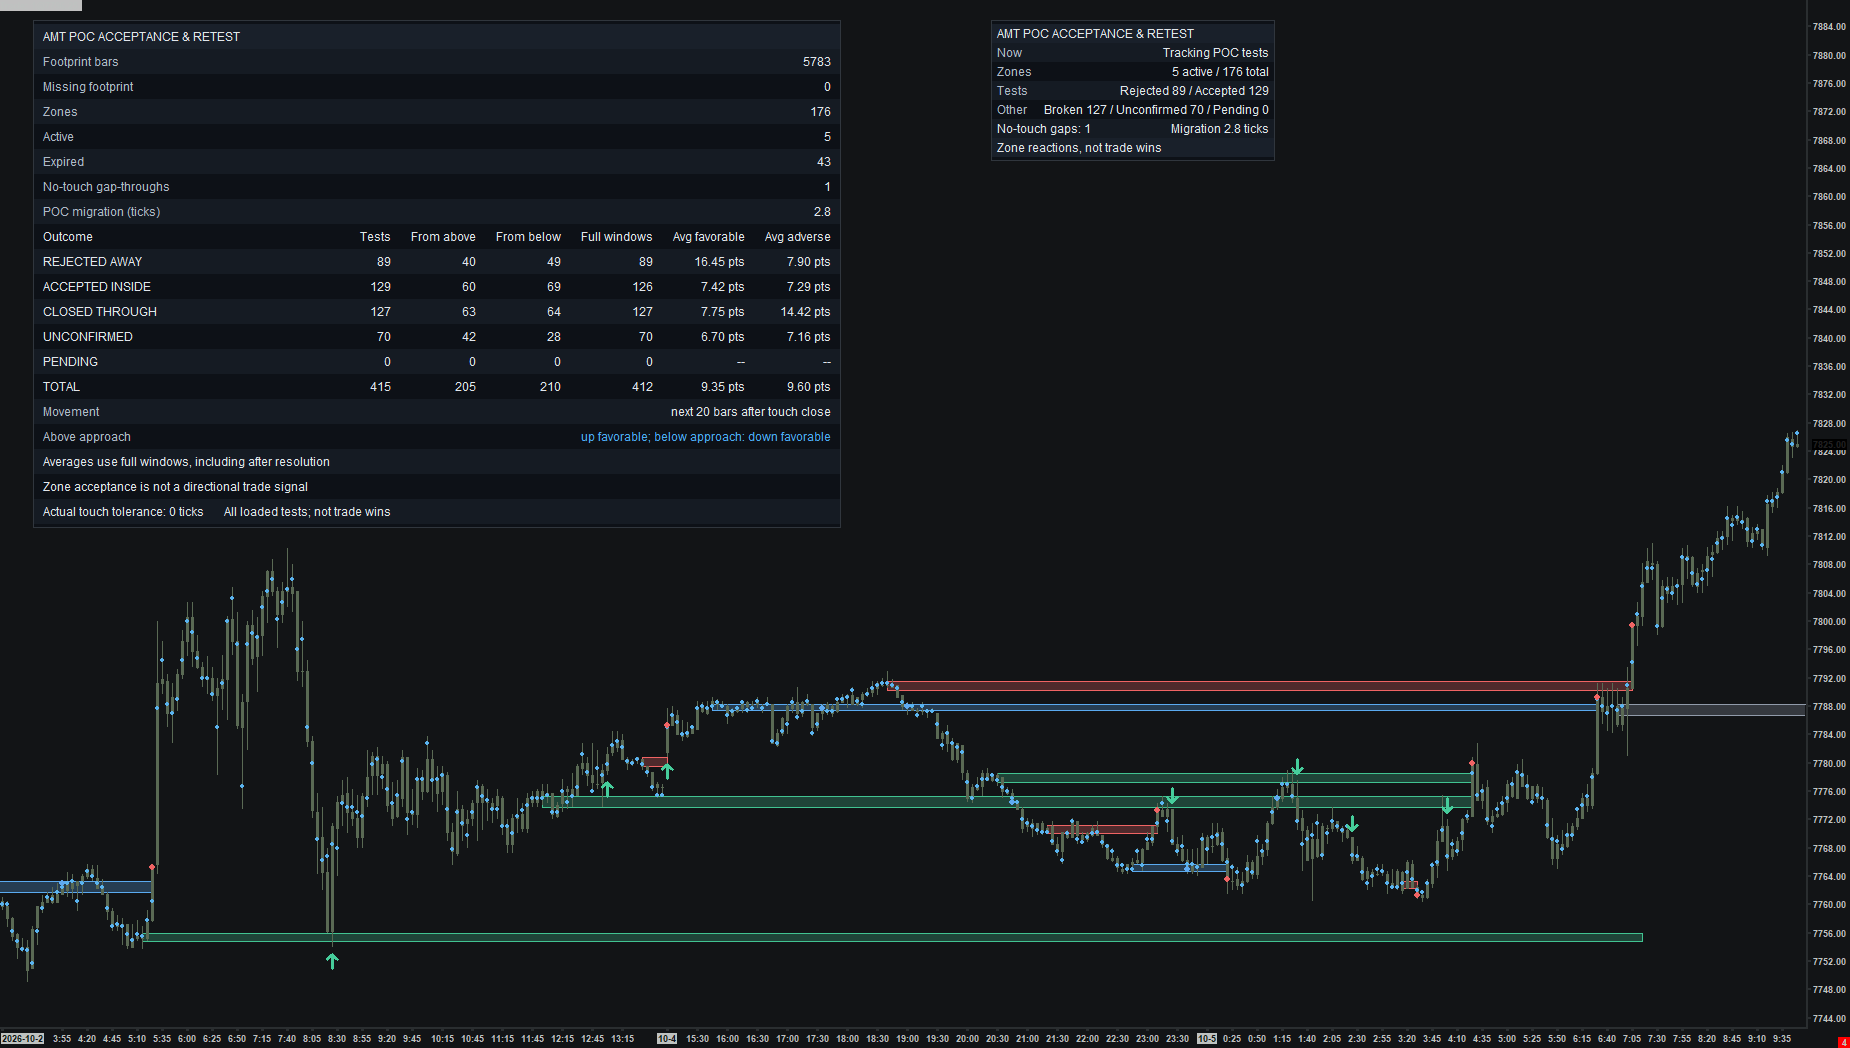
The detailed tables and historical labels help you verify, study, and learn how price reacted. Compact and detailed views are shown together here for comparison. Use the study display settings to show or hide supported after-reaction details; once familiar with the levels, keep your live trading chart as clean as you prefer. Historical observations are not trade win rates.
Beyond the free Toolkit
What this adds to POC Per Bar
In the free Toolkit
Plots each bar's highest-volume price and a moving average to show POC migration.
In paid Order Flow
Builds POC cluster zones and follows departure, actual retest, volume-backed acceptance, rejection, and close-through outcomes.
Move from identifying the high-volume price to reviewing how price behaves on a return to that area.
Explore the free POC Per Bar study →What it shows
A bar's point of control (POC) is its highest-volume price. This study follows clusters of those prices, waits for departure, and evaluates a return. Outcomes separate rejection, acceptance inside, and a close through the far side.
How to read it
- Identify the cluster and the side from which price departed.
- On the retest, watch consecutive closes and in-zone volume share. A touch alone is not acceptance.
- Distinguish acceptance inside from closing through. Rejection closes away from the departure-side edge.
Settings that matter
Departure distance, touch tolerance, acceptance-bar count, minimum in-zone volume share, decision window, and close-through buffer define the sequence.
Example sequence
Price leaves upward and returns. Qualifying closes inside with sufficient volume produce acceptance; a close back above the zone by the required distance supports rejection upward.
What to keep in mind
These are bar POCs, not automatically a full-session profile POC. Chart aggregation and footprint history affect results. Historical observations are not trade wins.