
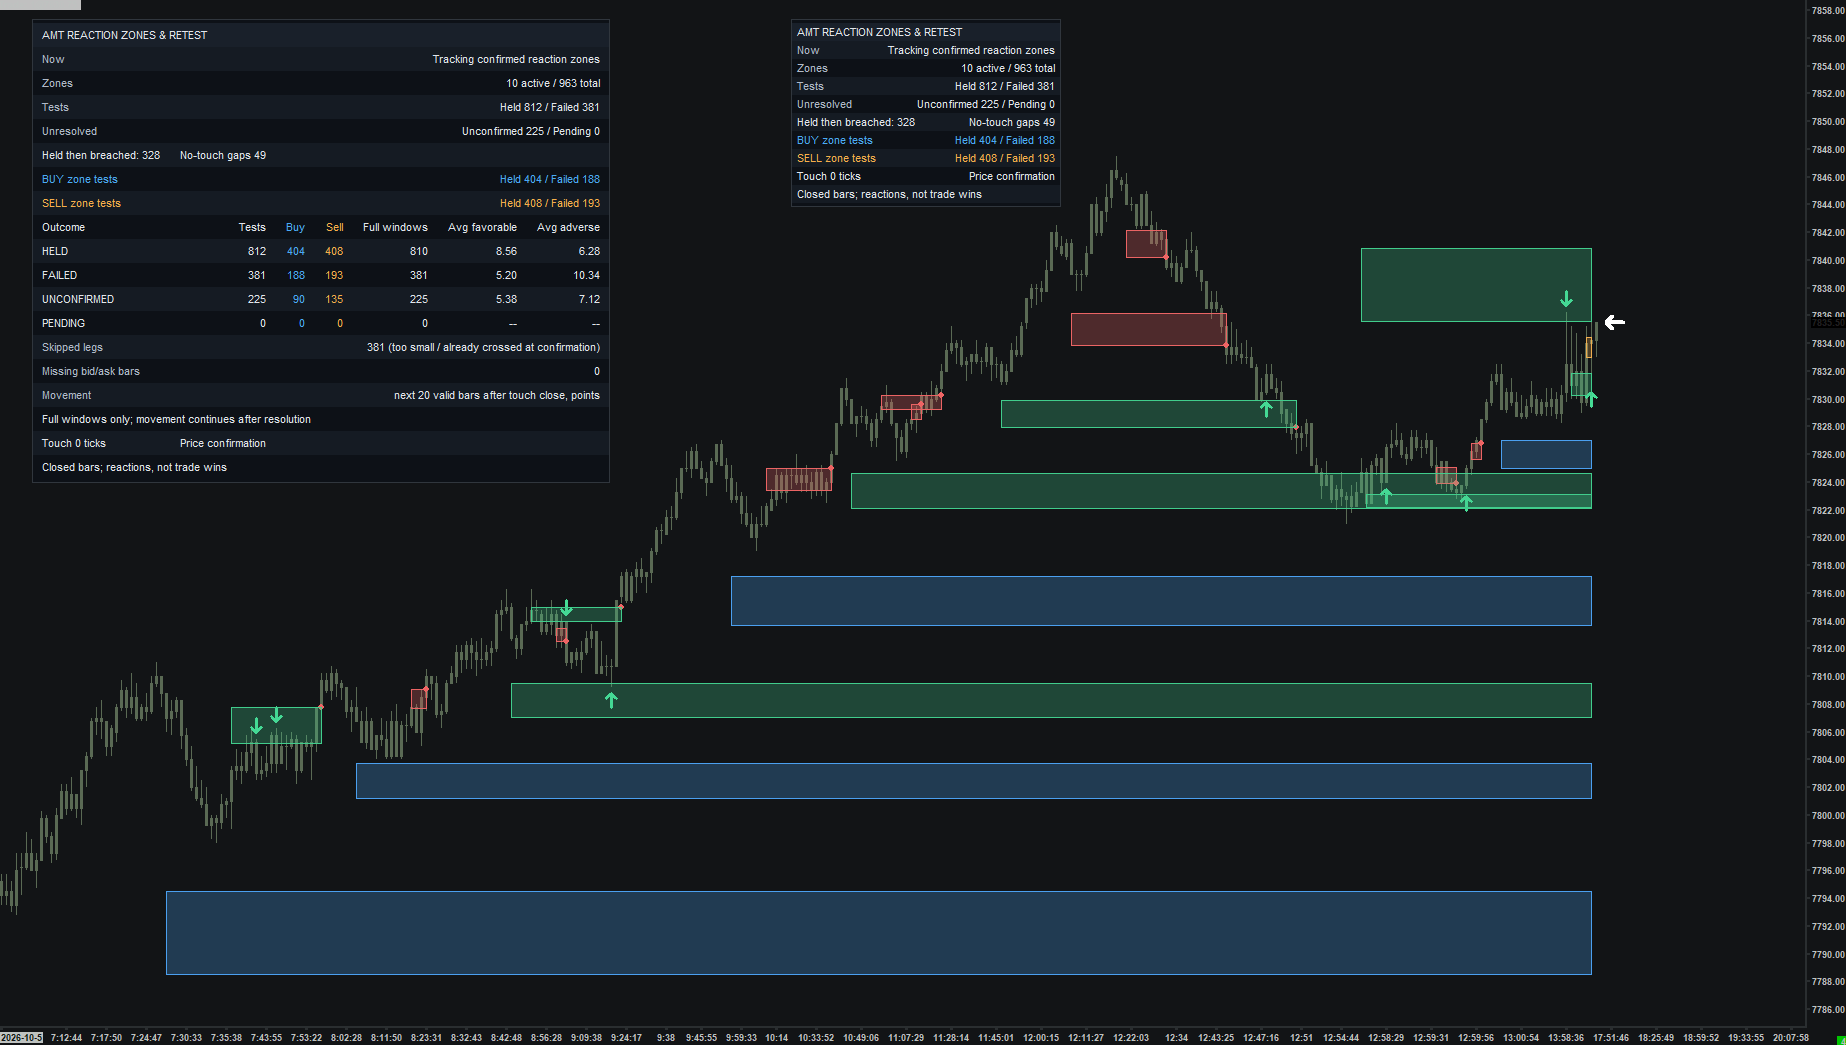
 Open full-size chart ↗
Review the history. Keep your chart clean.
The detailed tables and historical labels help you verify, study, and learn how price reacted. Compact and detailed views are shown together here for comparison. Use the study display settings to show or hide supported after-reaction details; once familiar with the levels, keep your live trading chart as clean as you prefer. Historical observations are not trade win rates.
Beyond the free Toolkit
What this adds to Reaction Zones
In the free Toolkit
Displays retracement reaction areas derived from rotations.
In paid Order Flow
Uses frozen zones from confirmed rotations and records departure, actual-touch tests, holds, breaches, expiry, and earlier holds that precede a later failure.
Review a zone's sequence of tests rather than relying only on the area currently drawn.
Explore the free Reaction Zones study →What it shows
Zones form from confirmed rotations and retain their original boundaries. The study follows departure, actual-touch tests, holds, breaches, and expiry. Earlier holds remain in the history if a zone later fails.
How to read it
- Identify the confirmed rotation that created the zone. The zone becomes available after confirmation.
- A touch starts a test; a qualifying reaction close confirms a hold.
- Read the full history. An earlier hold and a later breach can both be valid observations.
Settings that matter
Rotation and retracement settings define formation. Departure Close, Hold Reaction Close, Failure Close Buffer, and Test Decision Window define retests. Directional delta confirmation is optional.
Example sequence
An upward rotation creates a retracement zone. Price departs, returns, and closes upward by the required distance. A later breach does not erase the earlier hold.
What to keep in mind
A zone is a reference area, not a guaranteed turning point. Confirmation introduces delay. Chart interval and rotation settings change formation and test frequency.