
TRADINGVIEW · Spot sharp footprint delta shifts
AMT Delta Surge
for TradingView.
Highlight sharp candle-to-candle shifts in footprint delta percentage with adjustable chart markers. TradingView Premium or Ultimate required.
See the published script for current access information. Platform subscriptions and data requirements are separate.
TradingView Premium or Ultimate required
This indicator requests TradingView footprint data and requires a Premium or Ultimate plan. Adding the script does not unlock the feature for lower-tier accounts. Footprint data must also be available for your symbol and chart; a qualifying plan does not guarantee data on every bar. Market-data access and exchange subscriptions are separate. Use standard candles or bars; synthetic charts are unsupported.
Three filters define a surge
Delta percentage equals footprint delta divided by total footprint volume, multiplied by 100. A surge compares this value with the immediately preceding candle. By default, the absolute change must be at least 50 percentage points, the current absolute delta percentage at least 15%, and current footprint volume at least 100. All three filters must pass. The previous candle needs valid data but does not need to meet the current-bar volume minimum.
A shift is measured in percentage points
A move from +10% to +30% is a 20-percentage-point change, even though it is a 200% relative increase. It does not meet the default 50-point change filter. Review the change, current delta, and volume thresholds for your symbol and timeframe. ES, MES, and NQ can have very different volume levels; there is no universal preset or fixed market conversion.
Upward does not necessarily mean positive delta
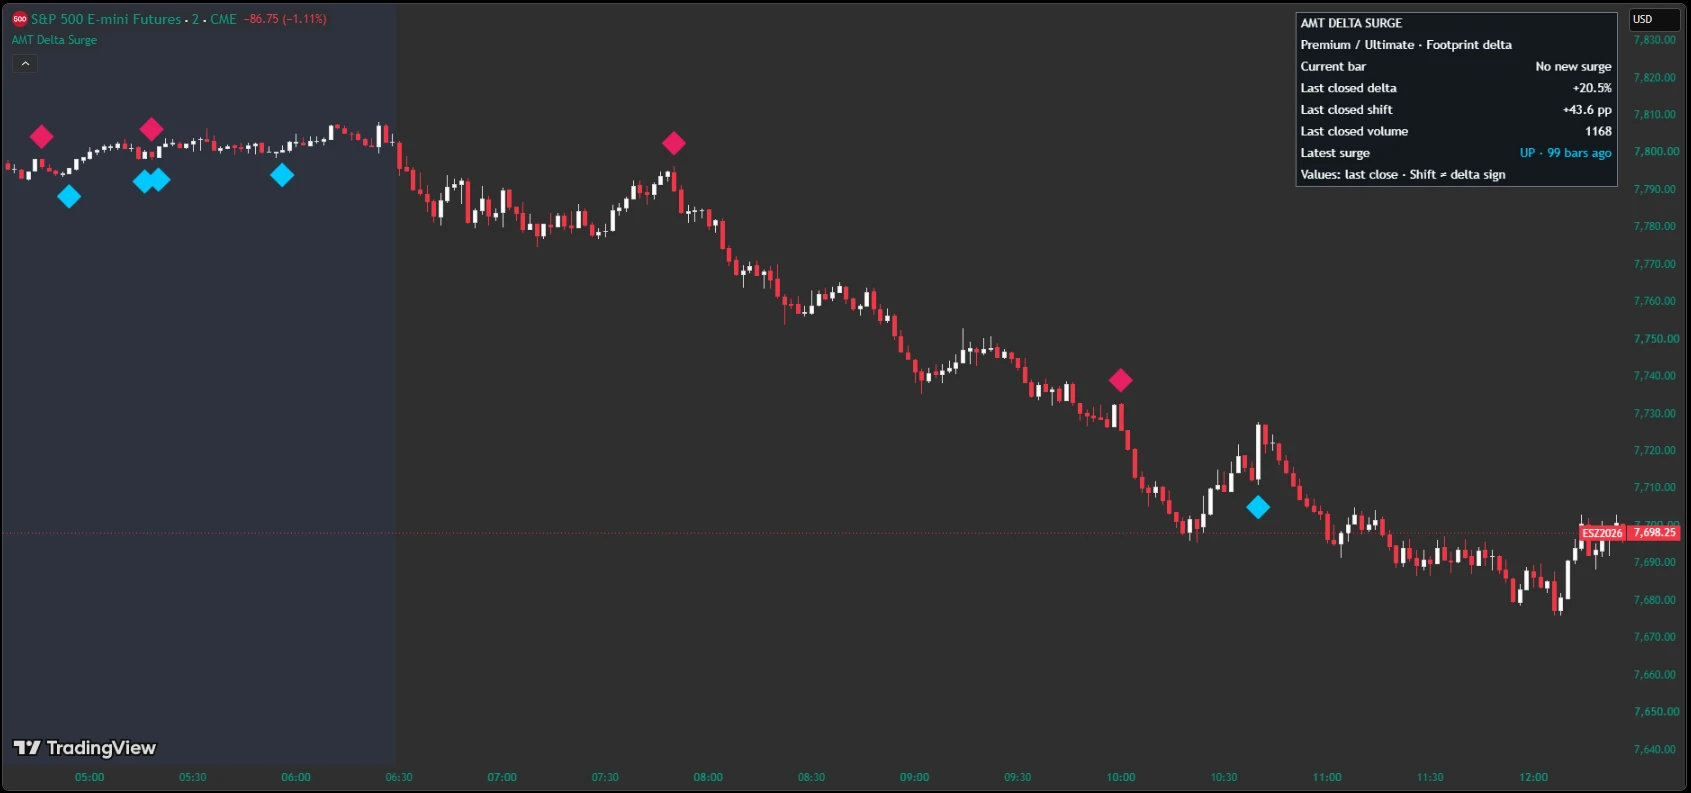
An upward marker means delta percentage increased sharply; a downward marker means it decreased sharply. A move from −80% to −20% is an upward shift of 60 percentage points while delta remains negative. A move from +80% to +20% is a downward shift while delta remains positive. Marker direction describes the change, not the candle’s price direction or a buy/sell instruction.
Choose readable markers and panel settings
Choose labels, arrows, bold triangles, diamonds, circles, or no markers. Marker size ranges from Tiny to Huge; labels can show the delta shift and current delta percentage. Adjust colors, fixed-tick or ATR-based spacing, and optional candle highlighting. The default retains the newest 200 markers, adjustable from 10 to 500, without limiting alerts. Hide the status panel or select any of nine positions and adjust its text size. It separates current-bar status from last-closed-bar values and shows the latest surge’s direction and age in bars.
Footprint settings and chart sessions
Ticks per footprint row defaults to 4 and controls aggregation. The calculation uses total delta and volume per candle, not row-by-row imbalance signals. The Data Window shows confirmed delta percentage, its change, footprint volume, and footprint delta. There is no session filter or daily reset: adjacent loaded candles are compared, including across a session gap. Your chart’s session selection changes which candles are adjacent.
Bar-close confirmation and missing data
Markers and alert conditions are evaluated at bar close; an open candle does not produce a confirmed surge. Both adjacent candles need valid footprint data with positive total volume. Missing data is not treated as zero delta, and the script does not compare across a missing-data candle. The panel identifies unavailable data or a wait for bar close.
Set alerts and understand the limits
Create alerts for upward surges, downward surges, or either direction and select Once Per Bar Close. Recreate alerts after changing settings. Symbol, interval, session, loaded history, footprint availability, and feed revisions can affect results; bar-close confirmation does not guarantee unchanged historical data. Use your own price context and risk plan. This educational indicator does not establish absorption, reversal, continuation, or profitability and is not an automated trading system. Trading involves risk.