
TRADINGVIEW · Measure swing size and variation
AMT Harmonic Rotations
for TradingView.
Measure confirmed price swings with rotation statistics and a size-distribution histogram. Compare developing movement with your selected historical sample.
See the published script for current access information. Platform subscriptions and data requirements are separate.
Set your timezone before your trading hours
Check the timezone displayed on your TradingView chart. In Settings → Inputs, enable Filter sample by pivot times, choose the matching Time zone from the dropdown, and enter your desired start and end times. The indicator does not automatically read the chart timezone. Changing the chart timezone does not change these settings, and changing the indicator timezone does not convert the clock times you entered.
Choose the window in your local time
For the same regular US stock-market session, use 09:30–16:00 Eastern (New York), 08:30–15:00 Central (Chicago), 07:30–14:00 Mountain (Denver), or 06:30–13:00 Pacific (Los Angeles). These are examples; choose the hours you want to study. City selections follow local daylight-saving rules where applicable. Exchange time zone uses the symbol’s exchange timezone, which can differ from your chart’s display timezone.
What the time filter includes
Both pivot bars must open inside the selected window for a rotation to enter the sample. The end time is excluded and overnight windows are supported. Swing detection continues outside the window; the filter controls the statistics, not the drawn swings. It does not reset at session boundaries or require both pivots to fall on the same date. Use intraday charts for an intraday time filter.
Confirmed rotations and the developing swing
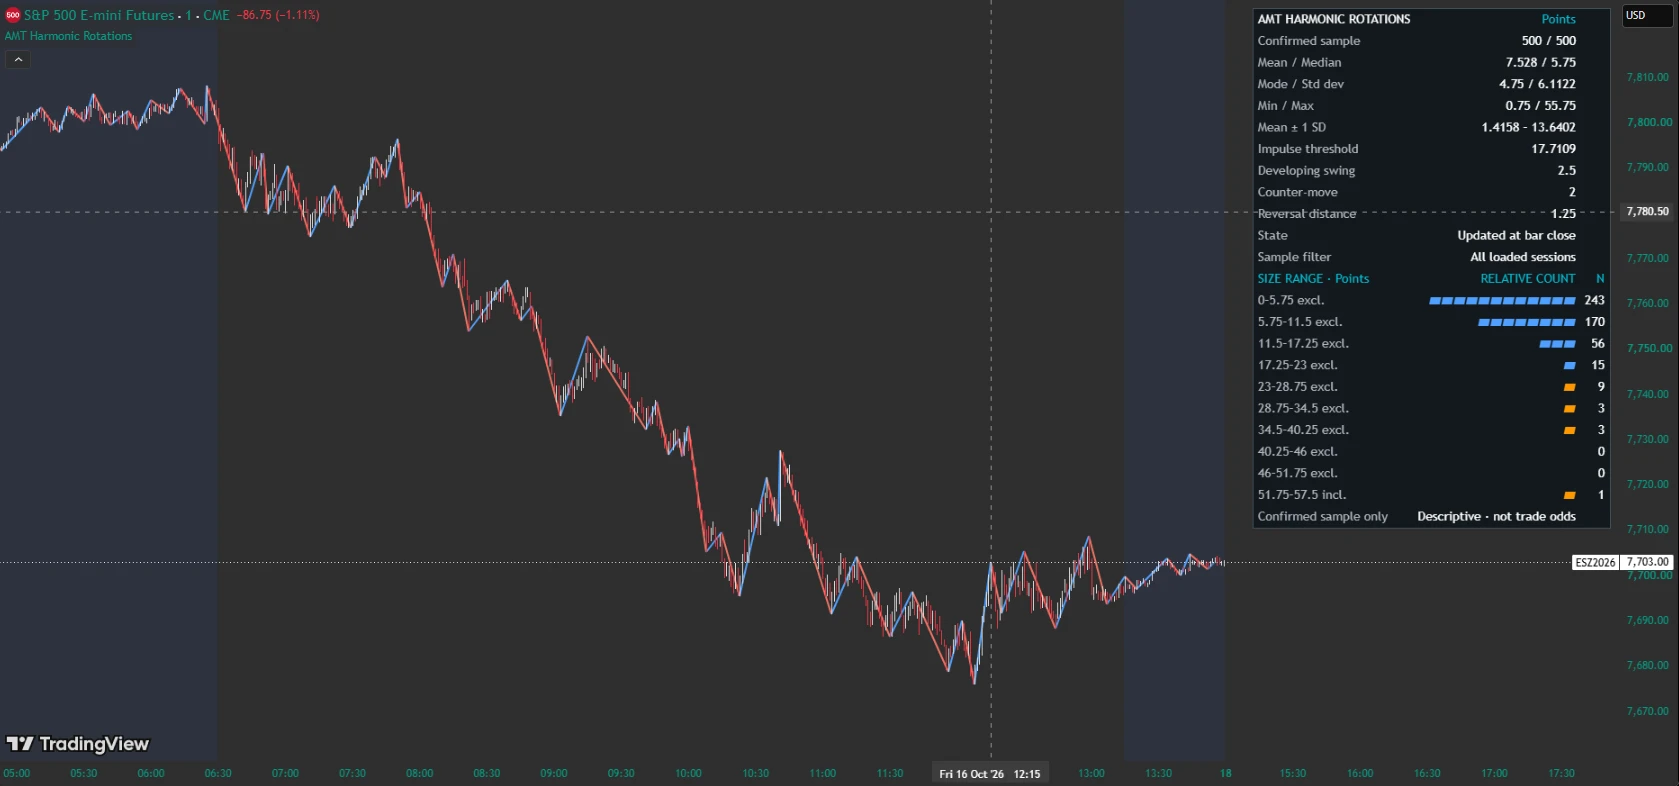
Reversal normally requires the selected number of bars since the latest extreme and a retracement strictly greater than the reversal distance. Breaking the preceding opposite pivot bypasses both requirements. A new or equal extreme takes precedence and restarts the wait. Calculations update at bar close. Lines connect historical pivot locations but become confirmed only after reversal; their placement is not an earlier signal. The dashed developing swing can change and is excluded from statistics.
Adjust Points, Ticks, and ATR for your market
Manual mode defaults to a 1.0-point reversal and five-bar wait. These are starting values, not optimized recommendations. Points means absolute price distance; Ticks means multiples of the minimum tick size. The Units setting changes both manual input meaning and displayed values. Review settings for ES, NQ, or any other instrument and timeframe. ATR-Based mode uses a 14-bar simple average of true range by default, with the manual distance as fallback before sufficient history is available.
Read the sample statistics
The panel uses the latest 500 eligible confirmed rotations by default, adjustable from 3 to 500, combining upward and downward swings. Mean is the average size; median is the middle value; mode is the most frequent tick-sized rotation, with ties choosing the smaller size. Standard deviation uses the population formula. Min and Max are sample extremes. Mean ± 1 SD is a descriptive band with a floor of zero, not a volume value area or a guarantee of 68% coverage. The impulse threshold is mean plus the selected standard-deviation multiplier, default 1.666.
Developing swing versus counter-move
Developing swing measures from the last confirmed pivot to the candidate extreme. Counter-move measures from that candidate extreme to the opposite extreme of the latest completed candle. IMPULSE appears when the counter-move reaches or exceeds the statistical threshold. It describes relative size, not direction, an entry signal, or guaranteed continuation.
Read the distribution and set alerts
Histogram ranges show counts of confirmed rotation sizes, with bars scaled to the largest count. Ranges adjust with the sample; upper boundaries are excluded except in the final bin. Orange identifies bins beginning at or above the impulse threshold. Customize colors, panel position, text size, histogram visibility, and visible line count. Alerts cover any confirmed rotation or an eligible sample addition. Select Once Per Bar Close in TradingView and recreate alerts after changing settings.
Chart requirements and limitations
Use standard candles or bars; synthetic charts are unsupported. The symbol, interval, session, feed, and loaded history can change rotations and statistics. The sample describes available chart data, not every historical session. This is an educational indicator, not an automated trading system. Statistical thresholds do not establish profitable entries or exits. Trading involves risk.