
TRADINGVIEW · Map potential pullback areas
AMT Reaction Zones
for TradingView.
Map potential retracement areas after a confirmed price rotation. Start with ES-oriented settings, then adjust point distances for NQ or other markets.
See the published script for current access information. Platform subscriptions and data requirements are separate.
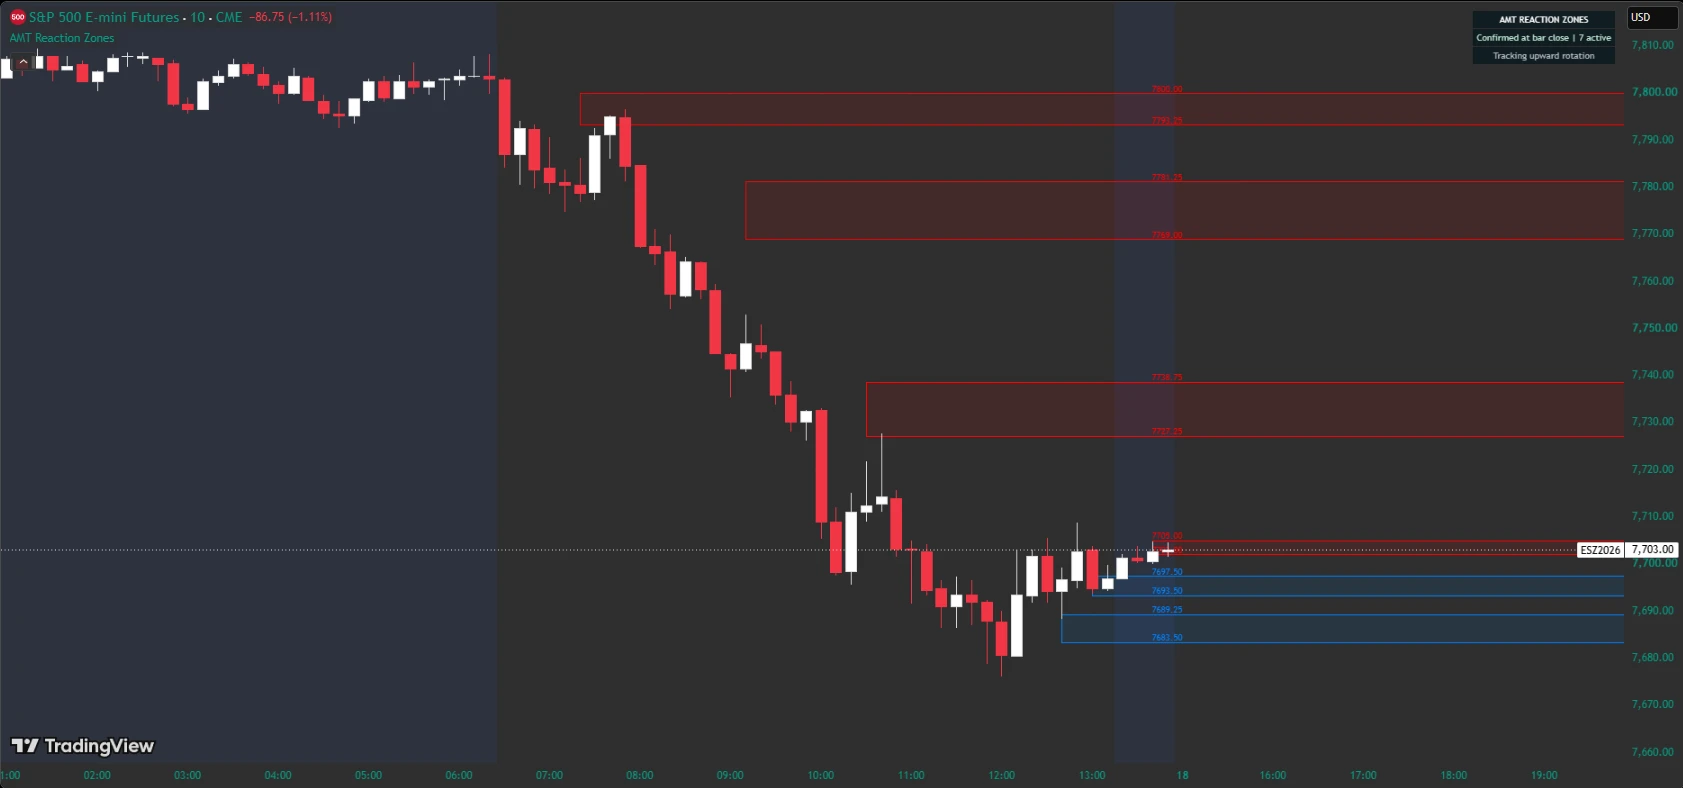
Where the zones come from
After an upward swing is confirmed, a buy reaction zone sits below its high. After a downward swing is confirmed, a sell reaction zone sits above its low. Both default to the 55%–75% retracement of the completed swing, with independently adjustable shallow and deep percentages. Buy and sell describe the setup direction; a zone is an area to observe, not an instruction to enter.
ES settings need adjustment for NQ
Manual rotation uses price points, not ticks or dollars. Its 5.5-point starting value is an ES-oriented reference, not an optimal setting for every chart. For NQ and other markets, review the point distance against price scale, tick size, volatility, and timeframe. Also adjust Minimum completed swing if enabled: it is measured in points too. There is no fixed ES-to-NQ conversion. Retracement percentages describe the proportion of a swing; point inputs describe an absolute distance.
Choose Manual or ATR-Based rotation
ATR-Based is the default: a 14-bar simple average of true range multiplied by 1.0. Review the period and multiplier for your market and timeframe. Before enough ATR history is available, the manual value supplies the fallback, multiplied by the ATR multiplier. Manual mode uses your chosen point distance.
Available at the confirmation candle’s close
Zones are created only after a swing reversal is confirmed at bar close. They begin on the confirmation candle, rather than being drawn back onto the earlier swing extreme. Normally, reversal requires the selected bar wait and a move greater than the rotation threshold. A break of the preceding opposite pivot can also confirm reversal. A new or equal swing extreme takes precedence on a candle that moves in both directions.
Invalidation, expiration, and display
A buy zone is invalidated when a completed candle’s low trades below its lower boundary; a sell zone when its high trades above the upper boundary. These are wick-based tests assessed at bar close. An exact boundary touch does not invalidate a zone. Zones already broken before confirmation are omitted. Erase, gray, or clip inactive zones, and optionally expire them after a selected number of bars from confirmation. Choose colors, transparency, borders, and price labels. The default display shows up to 20 zones with intersecting older zones hidden; the default retention limit is 500 zone records, adjustable in settings.
Set alerts in TradingView
Create alerts for new zones, first touches, or invalidations and select Once Per Bar Close. A visit before or on the confirmation candle is not counted again as a fresh touch. A candle breaking the far boundary produces an invalidation instead of a touch alert; expiration does not produce an invalidation alert. Alerts apply to retained active zones, including those hidden by display filters. Recreate alerts after changing settings.
Chart setup and limitations
Use standard candles or bars; synthetic charts are unsupported. Market, interval, session, loaded history, and data feed can change the swings and zones. This version uses the ATR available on each historical bar and confirmed swings. Apply your own market context, confirmation, and risk plan. This is an educational indicator, not an automated trading system, and no zone guarantees a reaction or a profitable trade.